By Amrit Singh, REALTOR® · The Oberoi Group at Intero Real Estate · Published October 7, 2026 · Data from the MLS
My September report on Fremont, Union City, Newark and Hayward was about supply: more houses for sale, fewer of them selling, and buyers getting more time to decide.
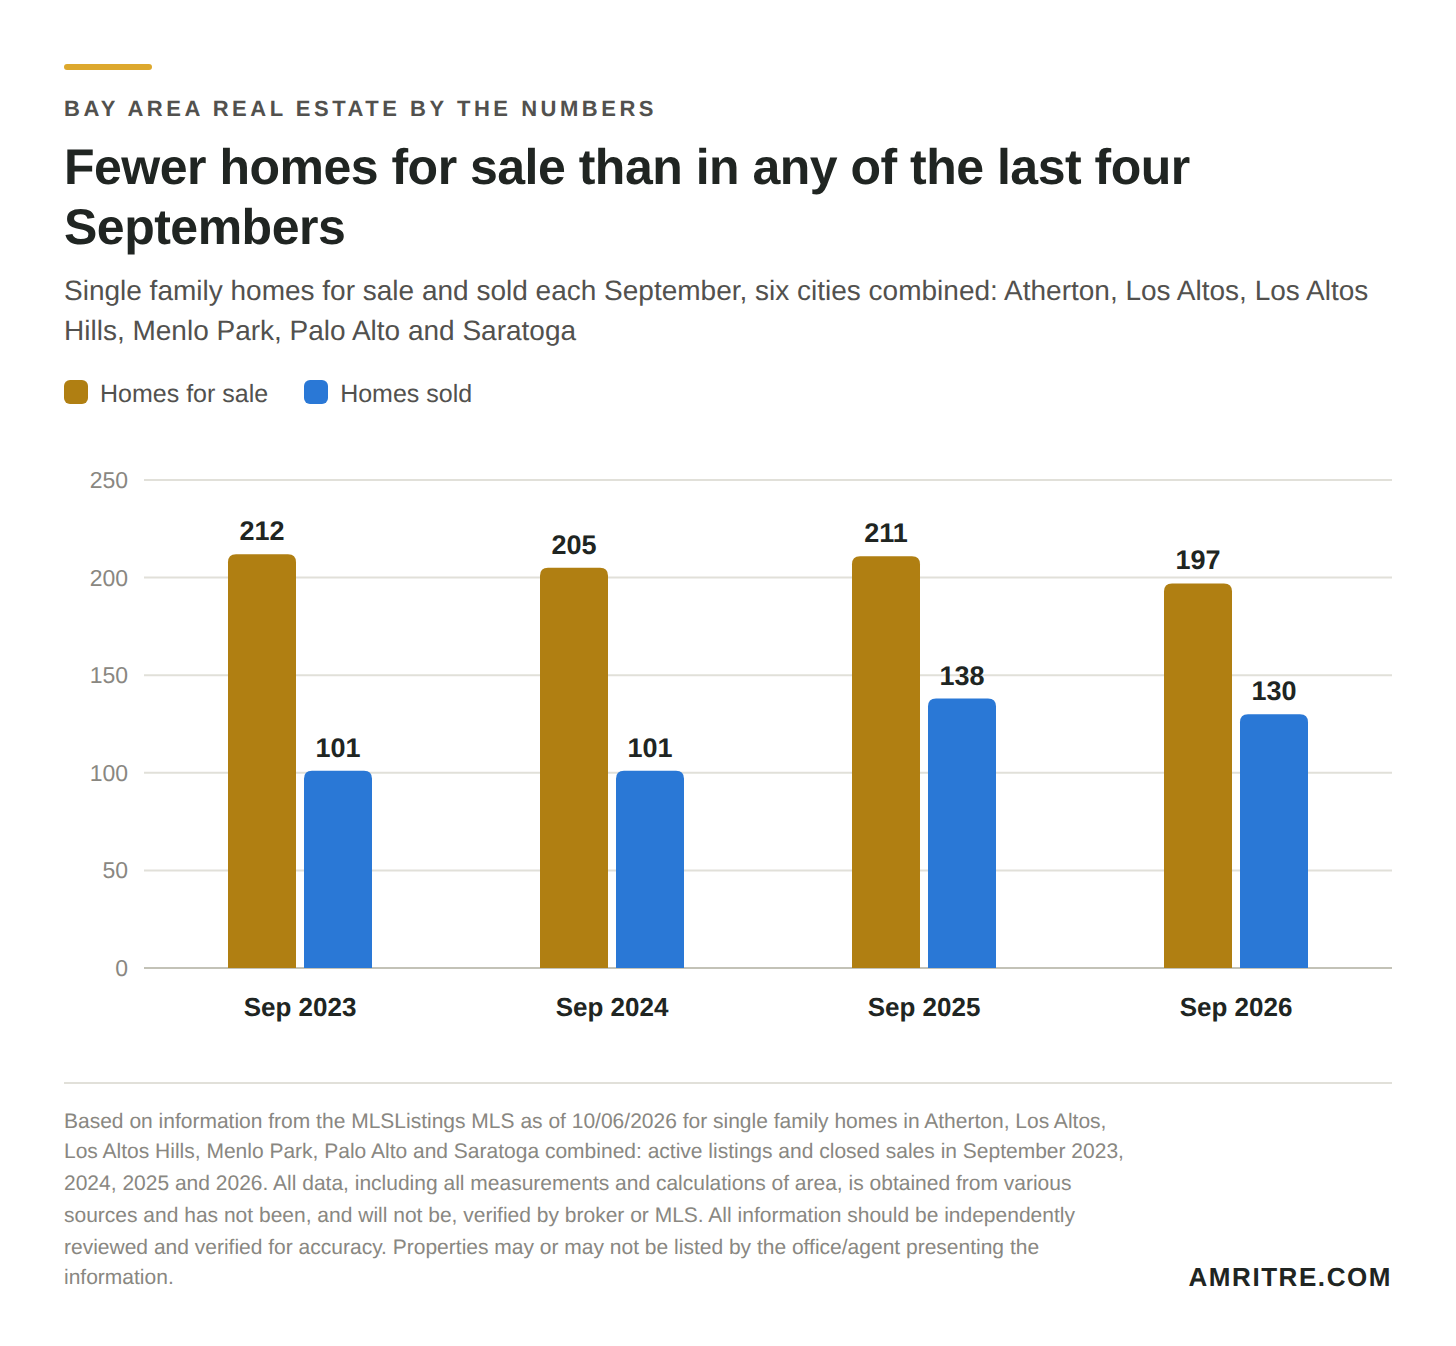
So I ran the same numbers for the top of the market: Atherton, Palo Alto, Menlo Park, Los Altos, Los Altos Hills and Saratoga. It’s a different market. There were 197 houses for sale across these six cities in September, the fewest of the last four Septembers, and more homes have sold for $5 million and up this year than last year.
The short version
- 197 houses for sale and 130 sold in September across the six cities. That’s about 1.5 months of supply, the same as last September and down from about 2 months in 2023 and 2024.
- 1,094 houses sold from January through September, up 3% from 1,060 last year.
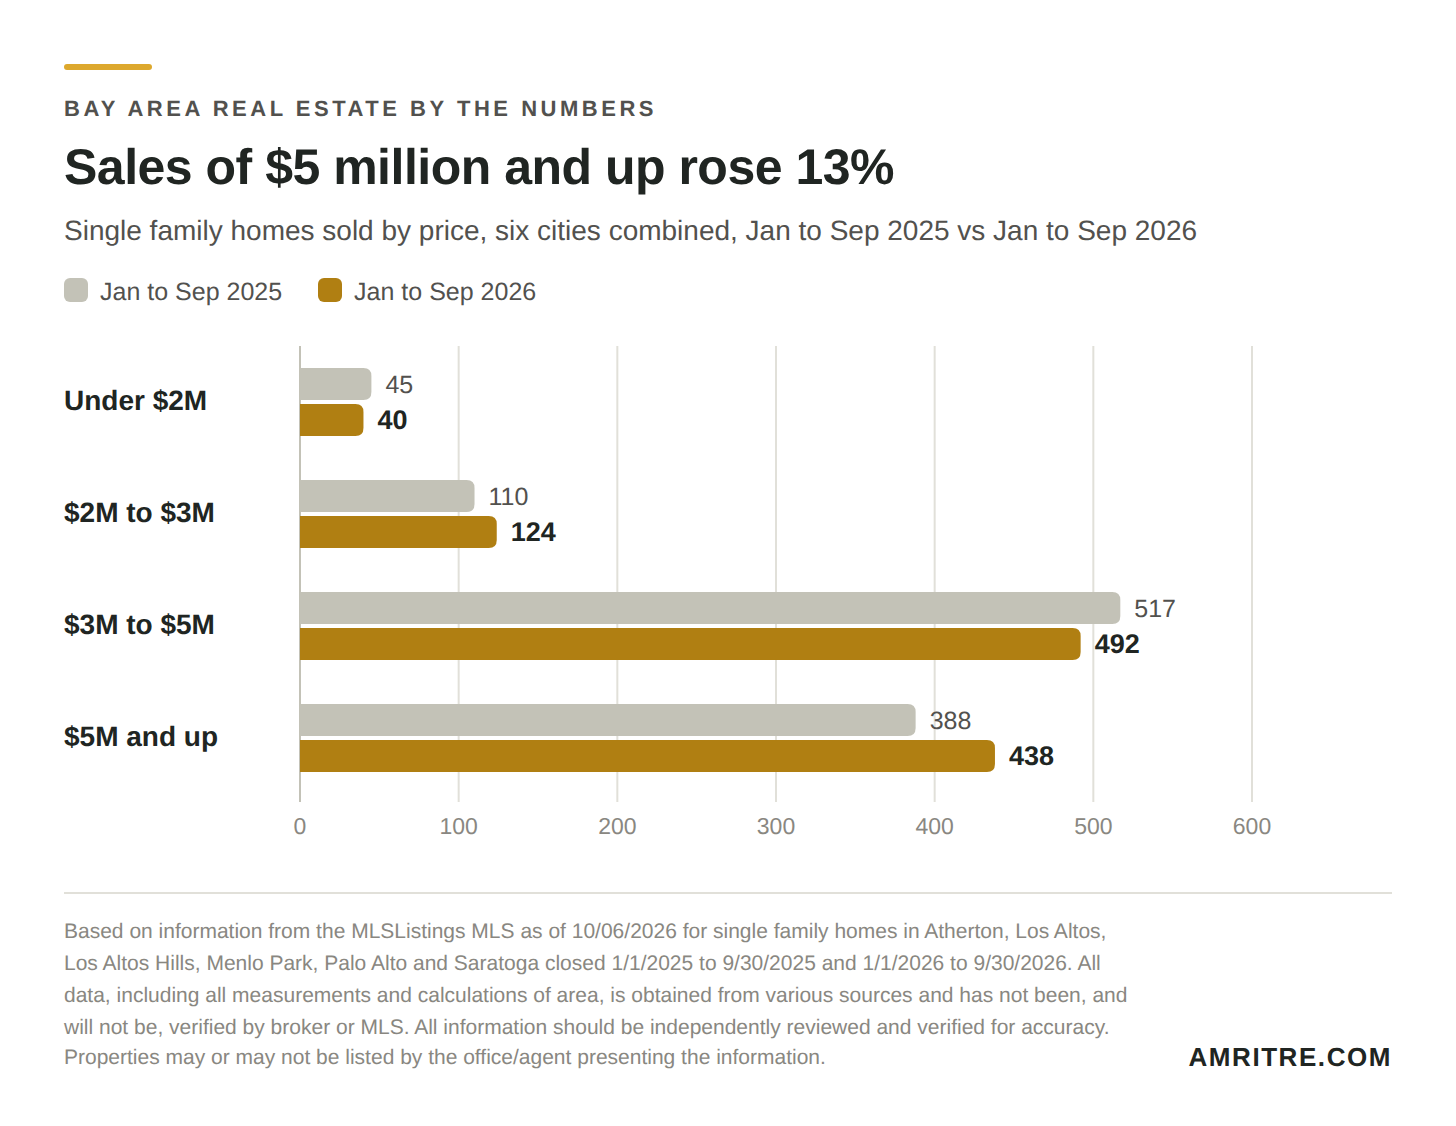
- 438 of them sold for $5 million or more, up 13% from 388. That’s four out of every ten sales.
- Sales between $3 million and $5 million slipped 5%, from 517 to 492.
- About $5.97 billion in sales so far this year, up 13% from $5.30 billion.
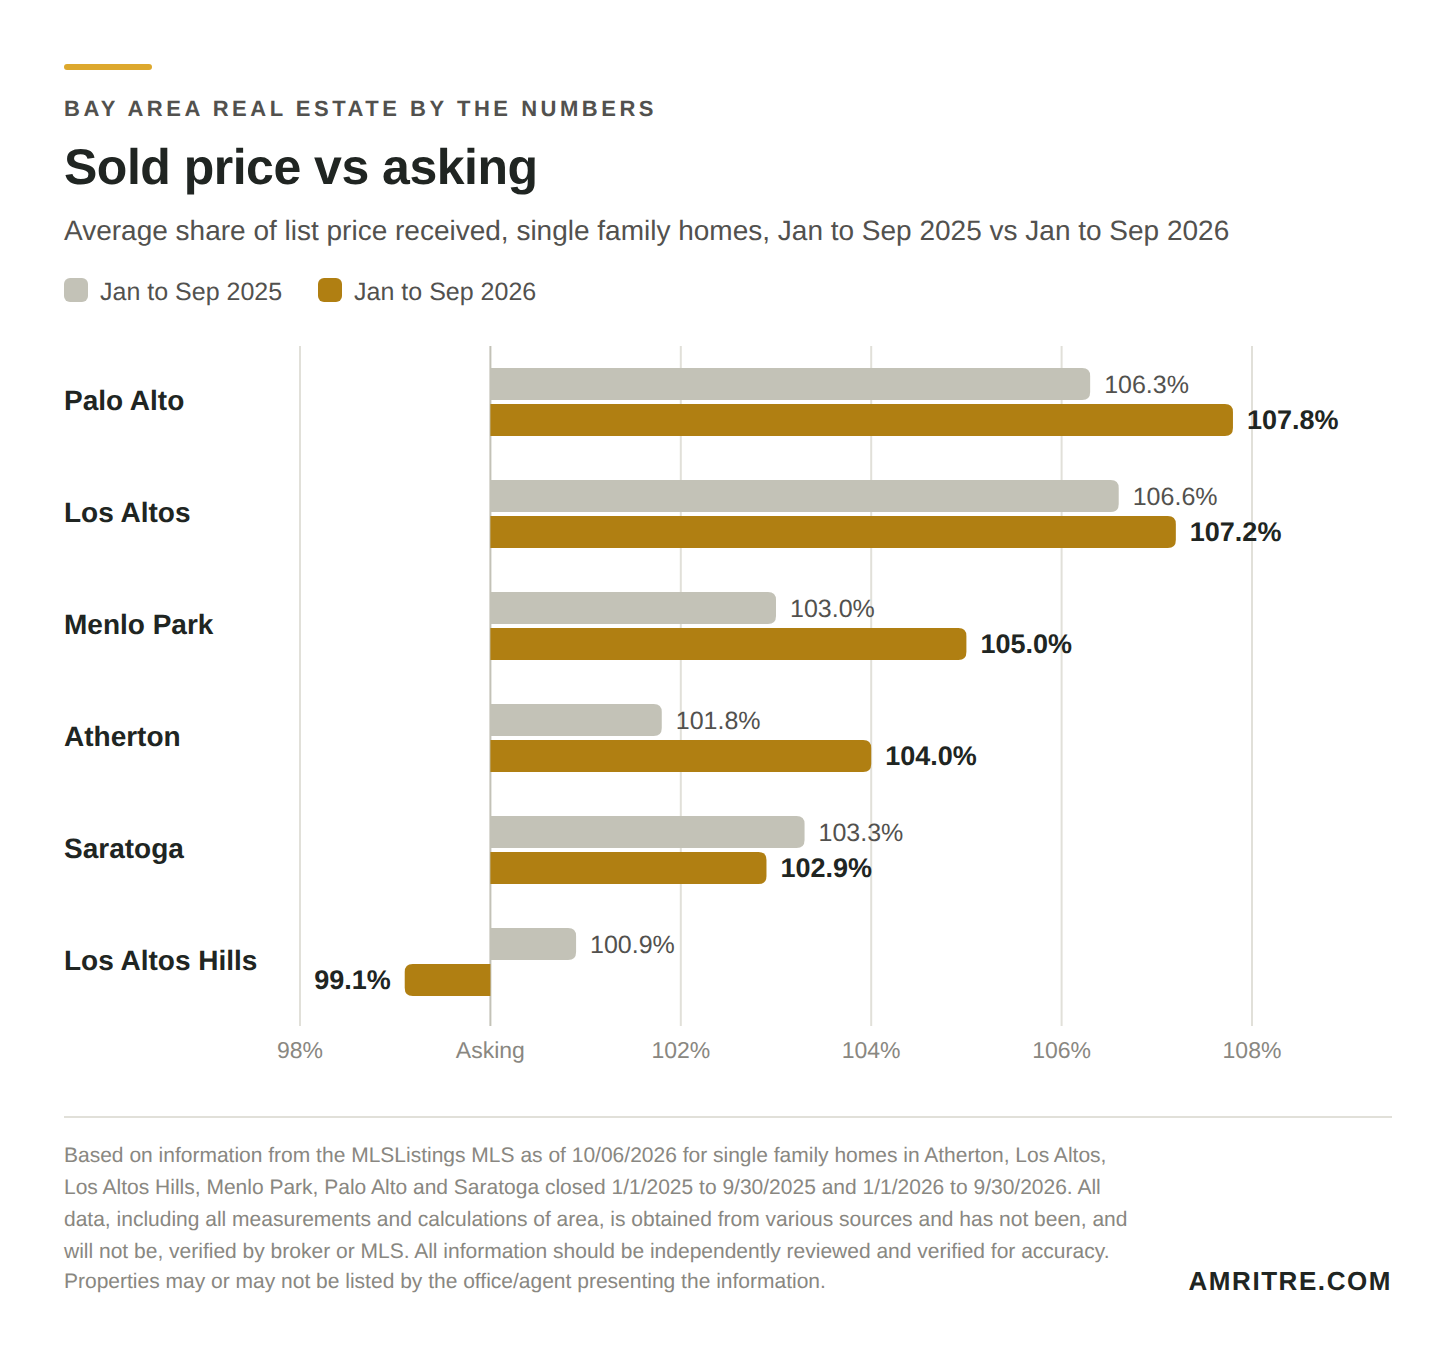
- Palo Alto and Los Altos homes sold for about 107% to 108% of asking, in a median of 8 days.
- Los Altos Hills is the exception: 99% of asking on average, and 15 days to sell.
City by city: single family homes
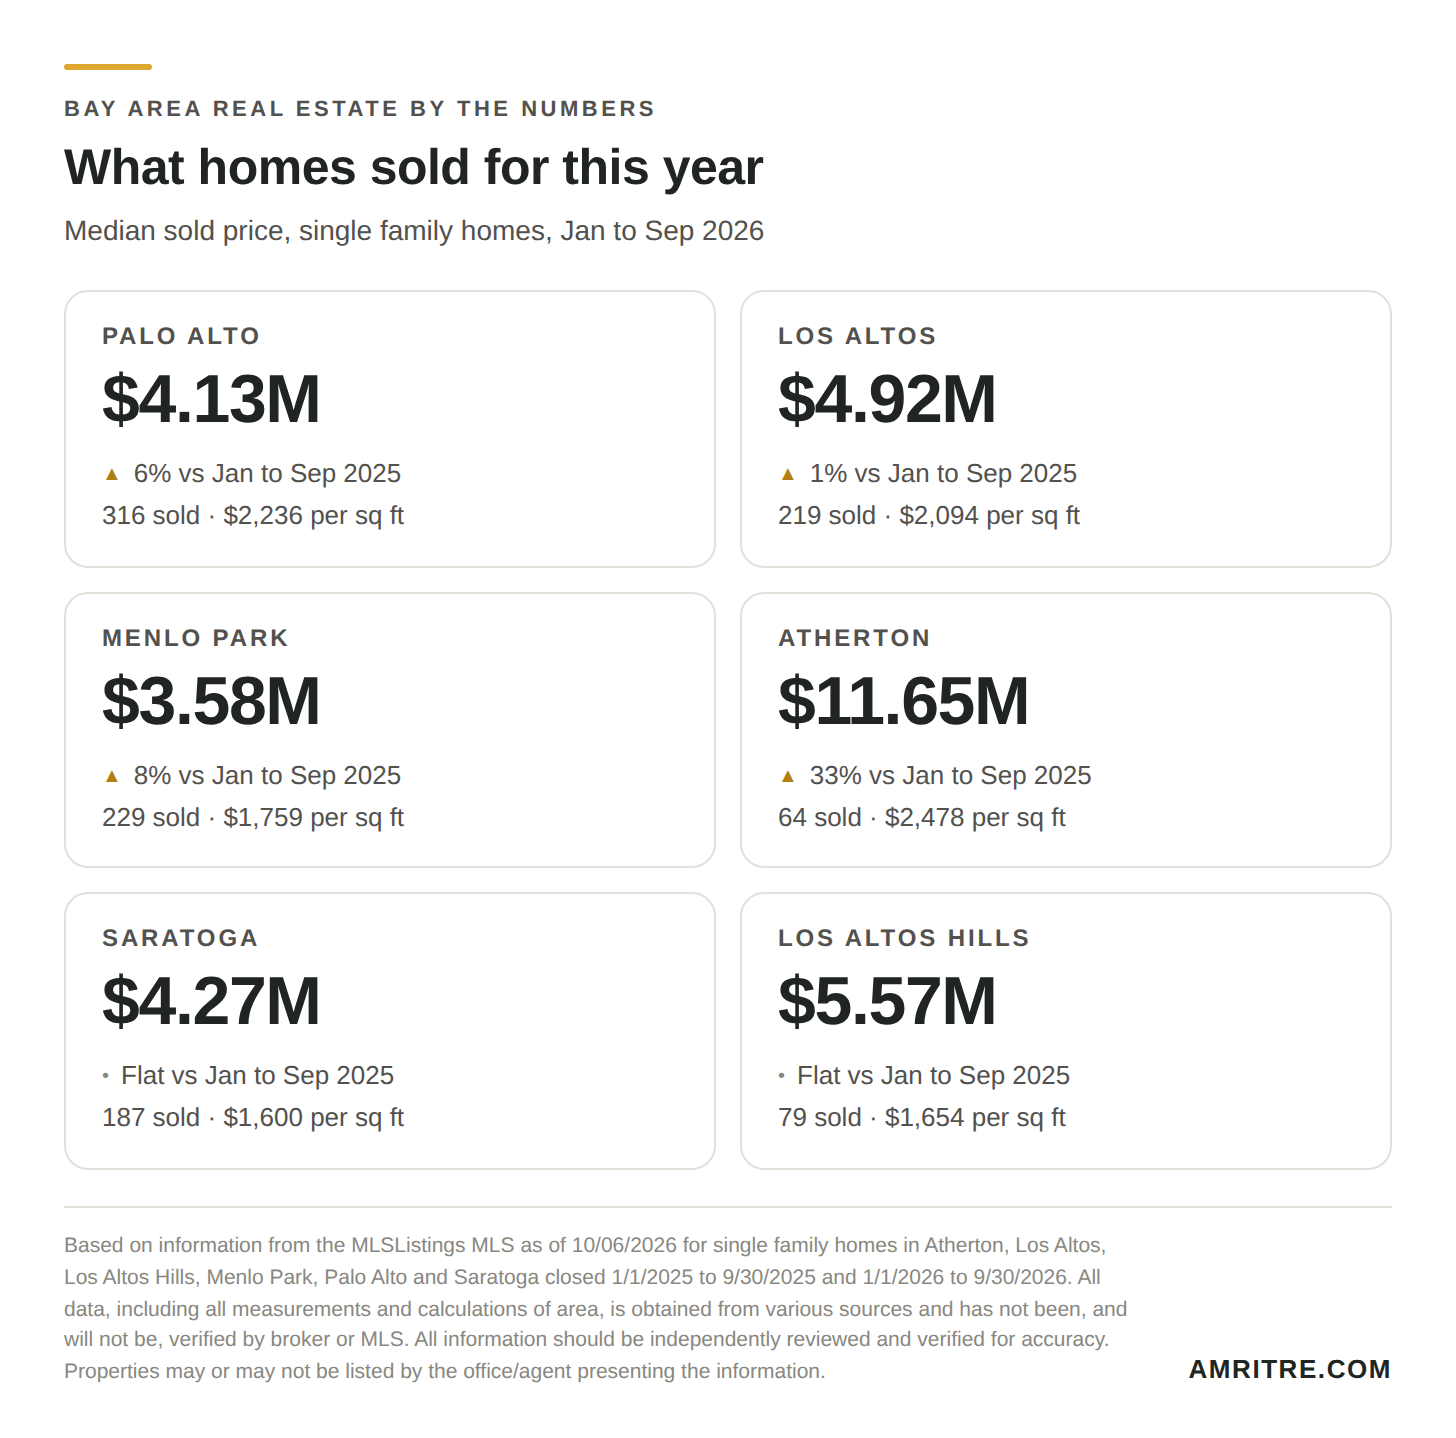
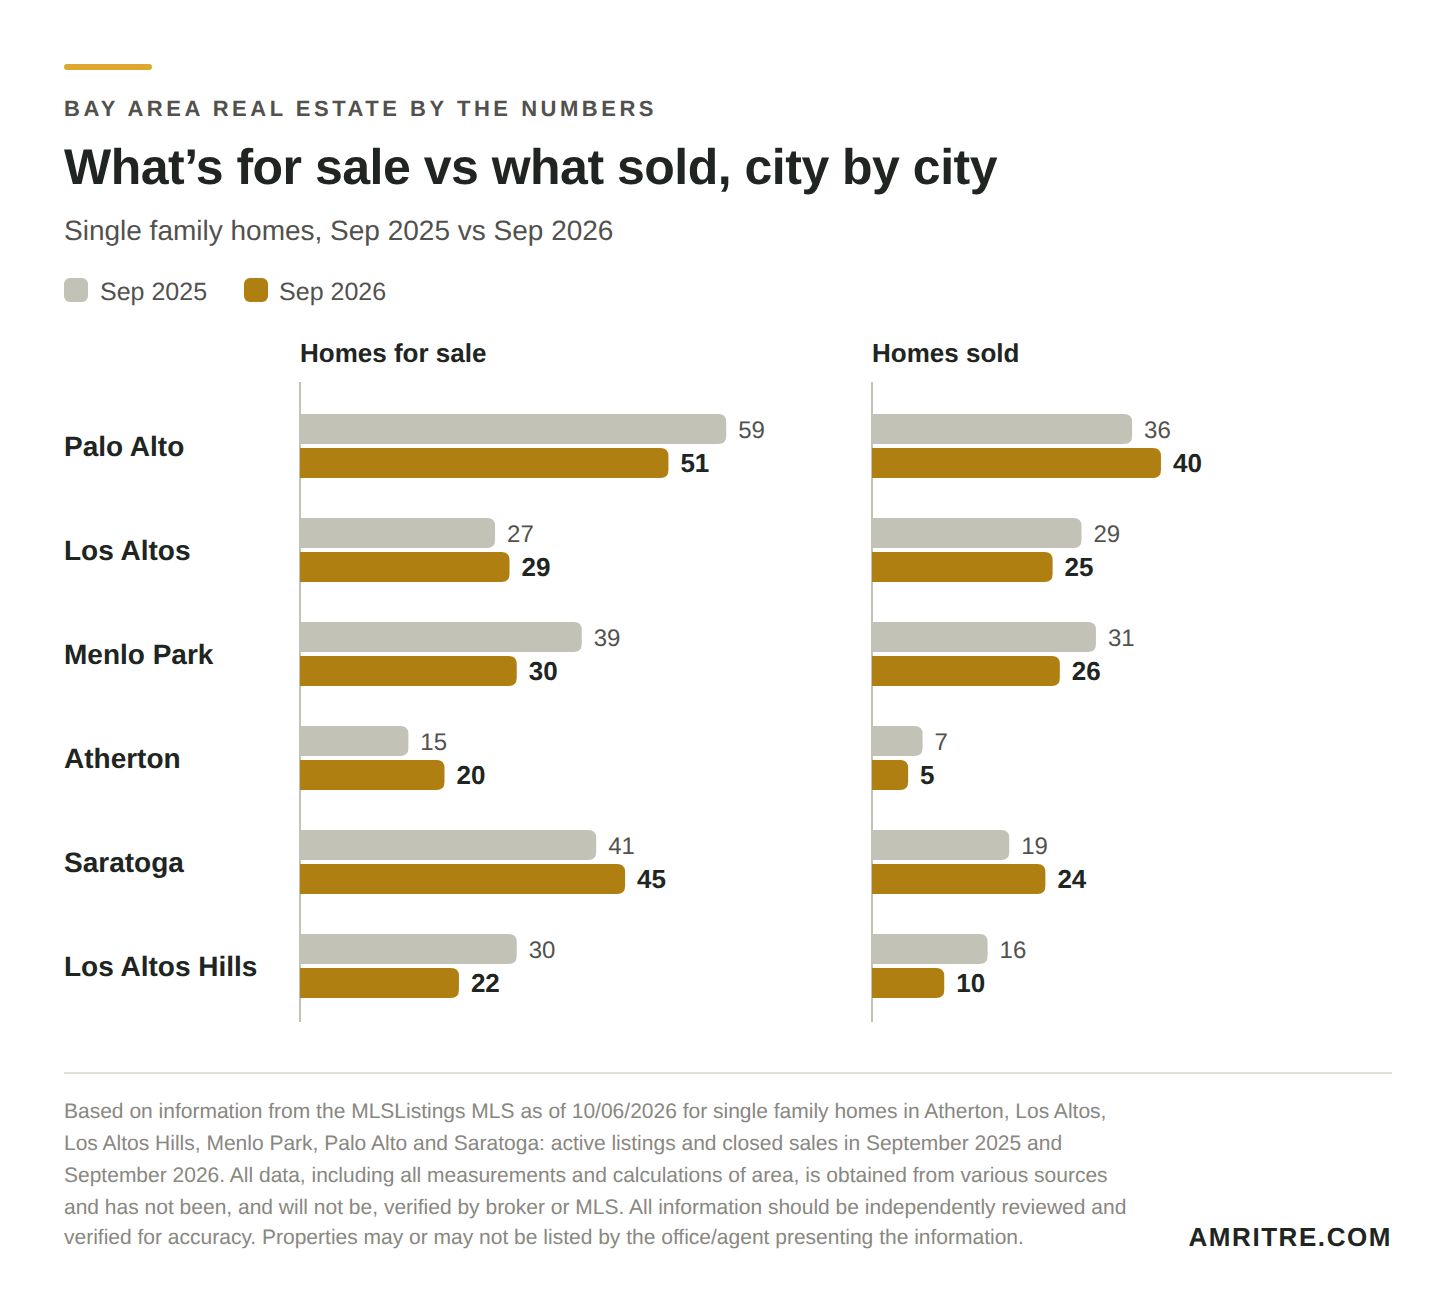
Palo Alto: 51 houses for sale and 40 sold in September, compared with 59 and 36 last September. That’s 1.3 months of supply, down from 1.6 last September. From January through September, 316 sold at a median of $4.13M, up 6% from a year earlier. Homes sold for 107.8% of asking on average, in a median of 8 days, at $2,236 per square foot (up 9% from a year earlier).
Los Altos: 29 houses for sale and 25 sold in September, compared with 27 and 29 last September. That’s 1.2 months of supply, up from 0.9 last September. From January through September, 219 sold at a median of $4.92M, up 1% from a year earlier. Homes sold for 107.2% of asking on average, in a median of 8 days, at $2,094 per square foot (up 8% from a year earlier).
Menlo Park: 30 houses for sale and 26 sold in September, compared with 39 and 31 last September. That’s 1.2 months of supply, down from 1.3 last September. From January through September, 229 sold at a median of $3.58M, up 8% from a year earlier. Homes sold for 105.0% of asking on average, in a median of 9 days, at $1,759 per square foot (up 6% from a year earlier).
Atherton: 20 houses for sale and 5 sold in September, compared with 15 and 7 last September. That’s 4.0 months of supply, up from 2.1 last September. From January through September, 64 sold at a median of $11.65M, up 33% from a year earlier. Homes sold for 104.0% of asking on average, in a median of 10 days, at $2,478 per square foot (up 17% from a year earlier). Atherton is a small market, so a few sales swing these numbers.
Saratoga: 45 houses for sale and 24 sold in September, compared with 41 and 19 last September. That’s 1.9 months of supply, down from 2.2 last September. From January through September, 187 sold at a median of $4.27M, flat with a year earlier. Homes sold for 102.9% of asking on average, in a median of 11 days, at $1,600 per square foot (flat with a year earlier).
Los Altos Hills: 22 houses for sale and 10 sold in September, compared with 30 and 16 last September. That’s 2.2 months of supply, up from 1.9 last September. From January through September, 79 sold at a median of $5.57M, flat with a year earlier. Homes sold for 99.1% of asking on average, in a median of 15 days, at $1,654 per square foot (up 3% from a year earlier).
What jumped out
The $5 million market is busier than last year
438 homes sold for $5 million or more from January through September, up 13% from 388. Four out of every ten sales in these six cities were $5 million and up. The one big price range that slowed was $3 million to $5 million, down 5%.
Palo Alto and Los Altos are still bidding markets
Homes sold for 107.8% of asking on average in Palo Alto and 107.2% in Los Altos, and half of them sold in 8 days or less. On a house listed at $4 million, 7% to 8% over asking is roughly $300,000 more.
Atherton’s median jumped 33%. Read it carefully.
Only 64 homes sold in Atherton this year, so a handful of big sales can move the median a lot. Price per square foot accounts for home size, and it rose 17%, from $2,120 to $2,478. Prices are up, just not as much as the median makes it look.
Los Altos Hills is where buyers have room
Homes sold for 99.1% of asking on average, the only one of the six cities below asking, and took a median of 15 days to sell, up from 10. The median price was flat at $5.57 million.
Same Bay Area, two different markets
In Fremont, Union City, Newark and Hayward, there were 338 houses for sale in September and 180 sold, close to 2 months of supply and the most houses for sale of the last four Septembers. Here, supply was the lowest of the last four Septembers. When someone tells you what “the Bay Area market” is doing, ask which part.
Read the East Bay numbers in the September report for Fremont, Union City, Newark and Hayward.
If you’re thinking about selling
- In Palo Alto, Los Altos and Menlo Park, half the homes sell in 9 days or less. Have inspections, disclosures and staging done before you list, because buyers decide fast.
- Over $5 million, buyers are active. Sales in that range are up 13% this year.
- In Los Altos Hills and Saratoga, buyers have more time and more choice, so pricing it right from day one matters more.
If you’re buying
- In Palo Alto and Los Altos, plan to pay over asking. The average this year was 107% to 108% of list price.
- Have your financing and inspections lined up before you write an offer. Half the homes in those two cities sold in 8 days or less.
- Los Altos Hills is the one city of the six where homes sold below asking on average.
- Look at price per square foot, not just the median. In a small market like Atherton, the median can swing on a few sales.
Homes for sale vs homes sold
Active listings and closed sales in September 2025 and September 2026. Months of supply is homes for sale divided by homes sold that month: how long it would take to sell everything on the market at that pace if nothing new got listed.
| City | For sale | Sold | Months of supply | |||
|---|---|---|---|---|---|---|
| 2025 | 2026 | 2025 | 2026 | 2025 | 2026 | |
| Palo Alto | 59 | 51 | 36 | 40 | 1.6 | 1.3 |
| Los Altos | 27 | 29 | 29 | 25 | 0.9 | 1.2 |
| Menlo Park | 39 | 30 | 31 | 26 | 1.3 | 1.2 |
| Atherton | 15 | 20 | 7 | 5 | 2.1 | 4.0 |
| Saratoga | 41 | 45 | 19 | 24 | 2.2 | 1.9 |
| Los Altos Hills | 30 | 22 | 16 | 10 | 1.9 | 2.2 |
| Total | 211 | 197 | 138 | 130 | 1.5 | 1.5 |
Every September since 2023
Single family homes, all six cities combined.
| Month | For sale | Sold | Months of supply |
|---|---|---|---|
| Sep 2023 | 212 | 101 | 2.1 |
| Sep 2024 | 205 | 101 | 2.0 |
| Sep 2025 | 211 | 138 | 1.5 |
| Sep 2026 | 197 | 130 | 1.5 |
Full numbers, January through September
Single family homes that closed from January 1 to September 30, 2026, compared with the same months of 2025. Median price and days on market are medians. % of asking is the average sold price as a share of list price. $ per sq ft is the average sold price per square foot.
Homes sold and median price
| City | Homes sold | Median price | Change | ||
|---|---|---|---|---|---|
| 2025 | 2026 | 2025 | 2026 | ||
| Palo Alto | 305 | 316 | $3.90M | $4.13M | Up 6% |
| Los Altos | 217 | 219 | $4.85M | $4.92M | Up 1% |
| Menlo Park | 229 | 229 | $3.30M | $3.58M | Up 8% |
| Atherton | 54 | 64 | $8.78M | $11.65M | Up 33% |
| Saratoga | 179 | 187 | $4.30M | $4.27M | Flat |
| Los Altos Hills | 76 | 79 | $5.55M | $5.57M | Flat |
Sold price vs asking and days on market
| City | % of asking | Days on market | ||
|---|---|---|---|---|
| 2025 | 2026 | 2025 | 2026 | |
| Palo Alto | 106.3% | 107.8% | 8 | 8 |
| Los Altos | 106.6% | 107.2% | 8 | 8 |
| Menlo Park | 103.0% | 105.0% | 11 | 9 |
| Atherton | 101.8% | 104.0% | 11 | 10 |
| Saratoga | 103.3% | 102.9% | 9 | 11 |
| Los Altos Hills | 100.9% | 99.1% | 10 | 15 |
Price per square foot
| City | 2025 | 2026 | Change |
|---|---|---|---|
| Palo Alto | $2,053 | $2,236 | Up 9% |
| Los Altos | $1,945 | $2,094 | Up 8% |
| Menlo Park | $1,662 | $1,759 | Up 6% |
| Atherton | $2,120 | $2,478 | Up 17% |
| Saratoga | $1,586 | $1,600 | Flat |
| Los Altos Hills | $1,610 | $1,654 | Up 3% |
Sales by price
| Sold price | 2025 | 2026 | Change |
|---|---|---|---|
| Under $2M | 45 | 40 | Down 11% |
| $2M to $3M | 110 | 124 | Up 13% |
| $3M to $5M | 517 | 492 | Down 5% |
| $5M and up | 388 | 438 | Up 13% |
| Total | 1,060 | 1,094 | Up 3% |
Questions people ask
Is the Palo Alto housing market slowing down?
Not by these numbers. From January through September 2026, Palo Alto homes sold for 107.8% of asking on average, in a median of 8 days. 316 sold, up from 305 a year earlier, and the median price was $4.13 million, up 6%. In September there were 51 houses for sale and 40 sold, about 1.3 months of supply.
What is the median home price in Atherton in 2026?
$11.65 million for single family homes sold from January through September 2026, based on 64 sales. That’s up 33% from $8.78 million a year earlier. With so few sales, a few large ones move the median a lot. Average price per square foot rose 17%, to $2,478.
How fast are homes selling in Los Altos?
Fast. Half the single family homes that sold from January through September 2026 sold in 8 days or less, and they sold for 107.2% of asking on average.
Are $5 million homes still selling in Silicon Valley?
Yes. Across Atherton, Palo Alto, Menlo Park, Los Altos, Los Altos Hills and Saratoga, 438 single family homes sold for $5 million or more from January through September 2026, up 13% from 388 a year earlier.
Where do buyers have the most room to negotiate at the high end?
Los Altos Hills. Homes there sold for 99.1% of asking on average from January through September 2026, the only one of these six cities below asking, with a median of 15 days to sell.
Is the high end doing the same thing as the East Bay?
No. In Fremont, Union City, Newark and Hayward, September 2026 had 338 houses for sale and 180 sold, close to 2 months of supply and the most houses for sale of the last four Septembers. Across these six high end cities, supply was the lowest of the last four Septembers.
WHAT’S YOUR HOME WORTH IN THIS MARKET?
Get your home’s value from Amrit, based on your actual comps, not an online estimate
Based on information from the MLSListings MLS as of 10/06/2026 for single family homes in Atherton, Los Altos, Los Altos Hills, Menlo Park, Palo Alto and Saratoga: active listings and closed sales in September 2023, 2024, 2025 and 2026, and closed sales 1/1/2025 to 9/30/2025 and 1/1/2026 to 9/30/2026; and for single family homes in Fremont, Union City, Newark and Hayward: active listings and closed sales in September 2023, 2024, 2025 and 2026. All data, including all measurements and calculations of area, is obtained from various sources and has not been, and will not be, verified by broker or MLS. All information should be independently reviewed and verified for accuracy. Properties may or may not be listed by the office/agent presenting the information. Percent changes are calculated from the figures shown.