By Amrit Singh, REALTOR® · The Oberoi Group at Intero Real Estate · Published October 6, 2026 · Data from the MLS
Everyone likes to quote days on market. In September, half the houses that sold in Fremont went in 12 days or less. That sounds like a red hot market.
But days on market only counts the homes that sold. It tells you nothing about the ones that didn’t. So this month I pulled the other half from the MLS: how many houses were for sale in Fremont, Union City, Newark and Hayward, how many actually sold, and how that compares with last September.
The short version
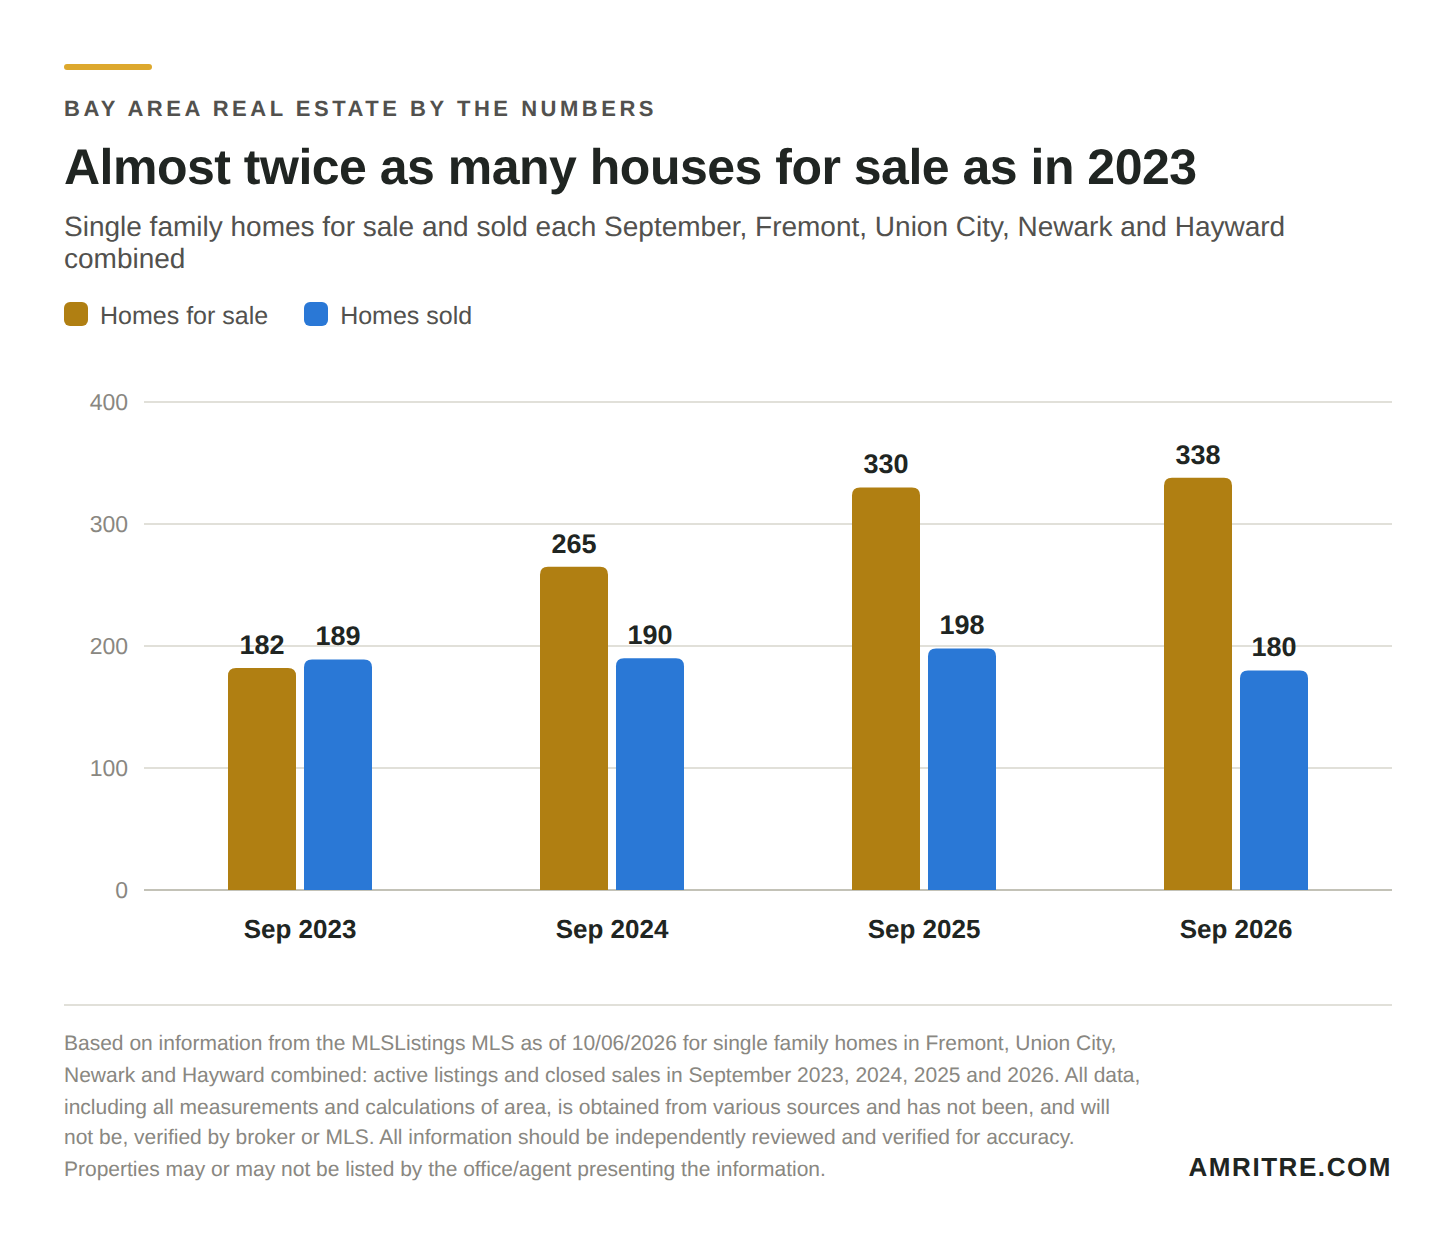
- 338 houses were for sale across Fremont, Union City, Newark and Hayward in September. That’s about the same as last September (330) and almost twice as many as September 2023 (182).
- 180 sold, 18 fewer than last September. Buyers have more choice than they’ve had in years.
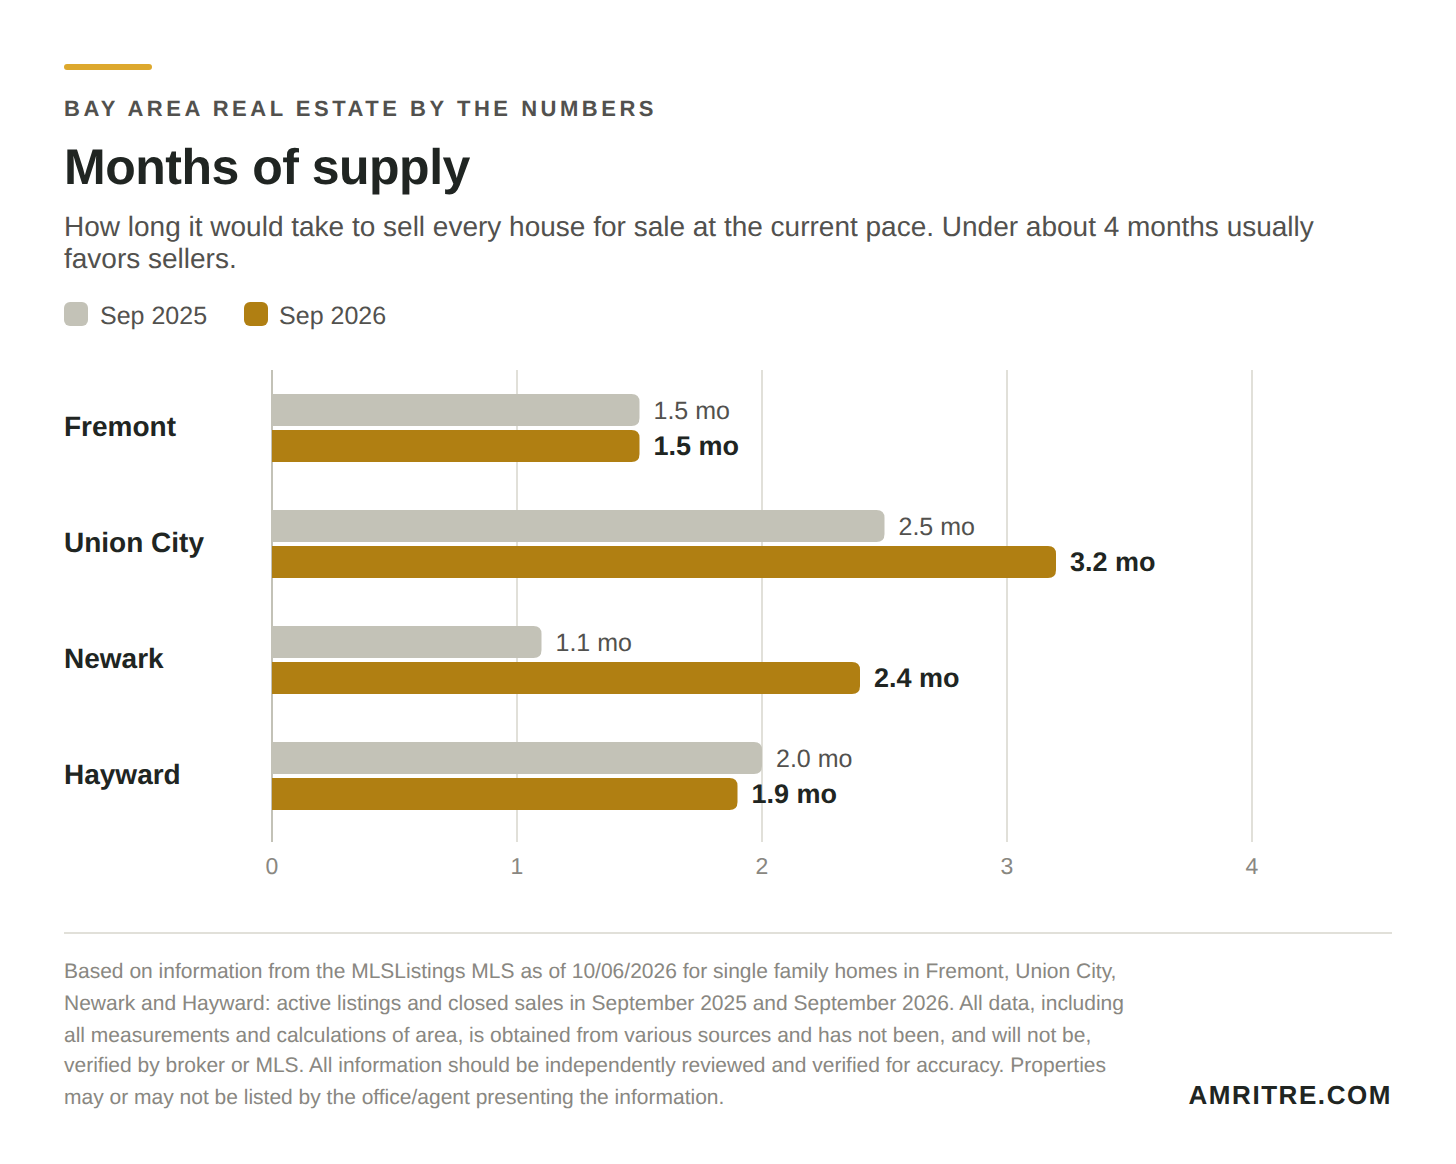
- Houses are still a seller’s market in all four cities, with 1.5 to 3.2 months of supply. But Newark and Union City have a lot more competition than a year ago.
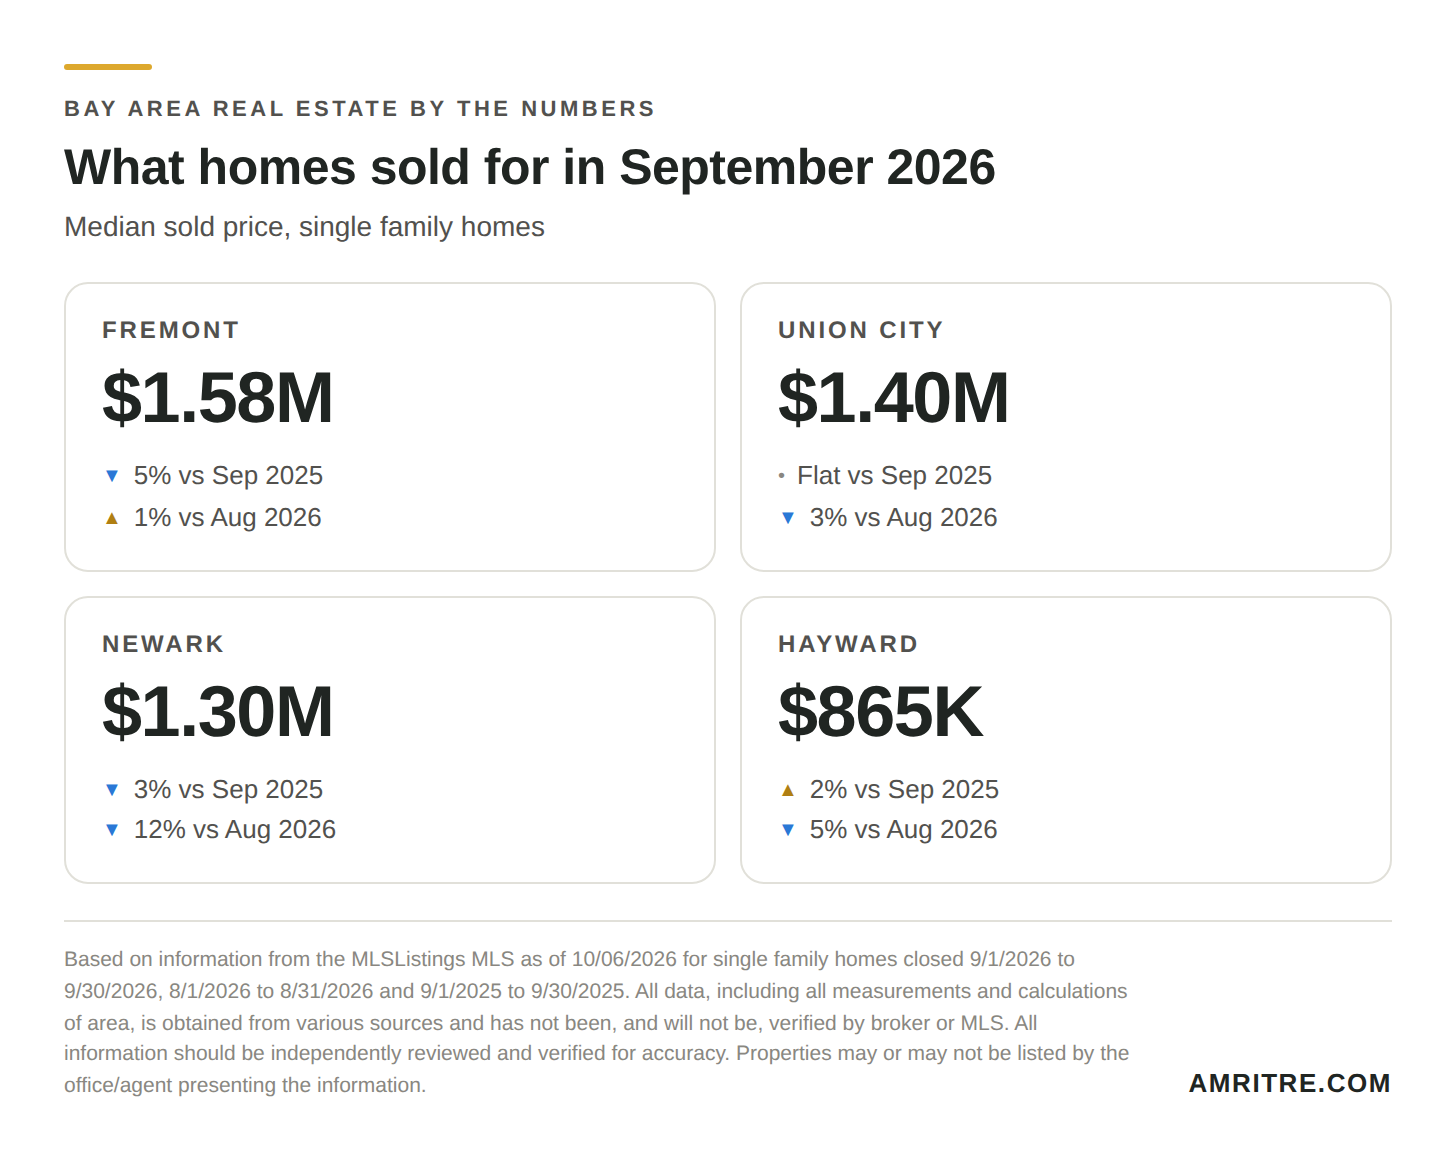
- Prices are mixed. Hayward is up 2% from last September and Union City is flat. Newark is down 3% and Fremont 5%.
- Condos and townhomes are the soft spot: 259 for sale and only 64 sold.
City by city: single family homes
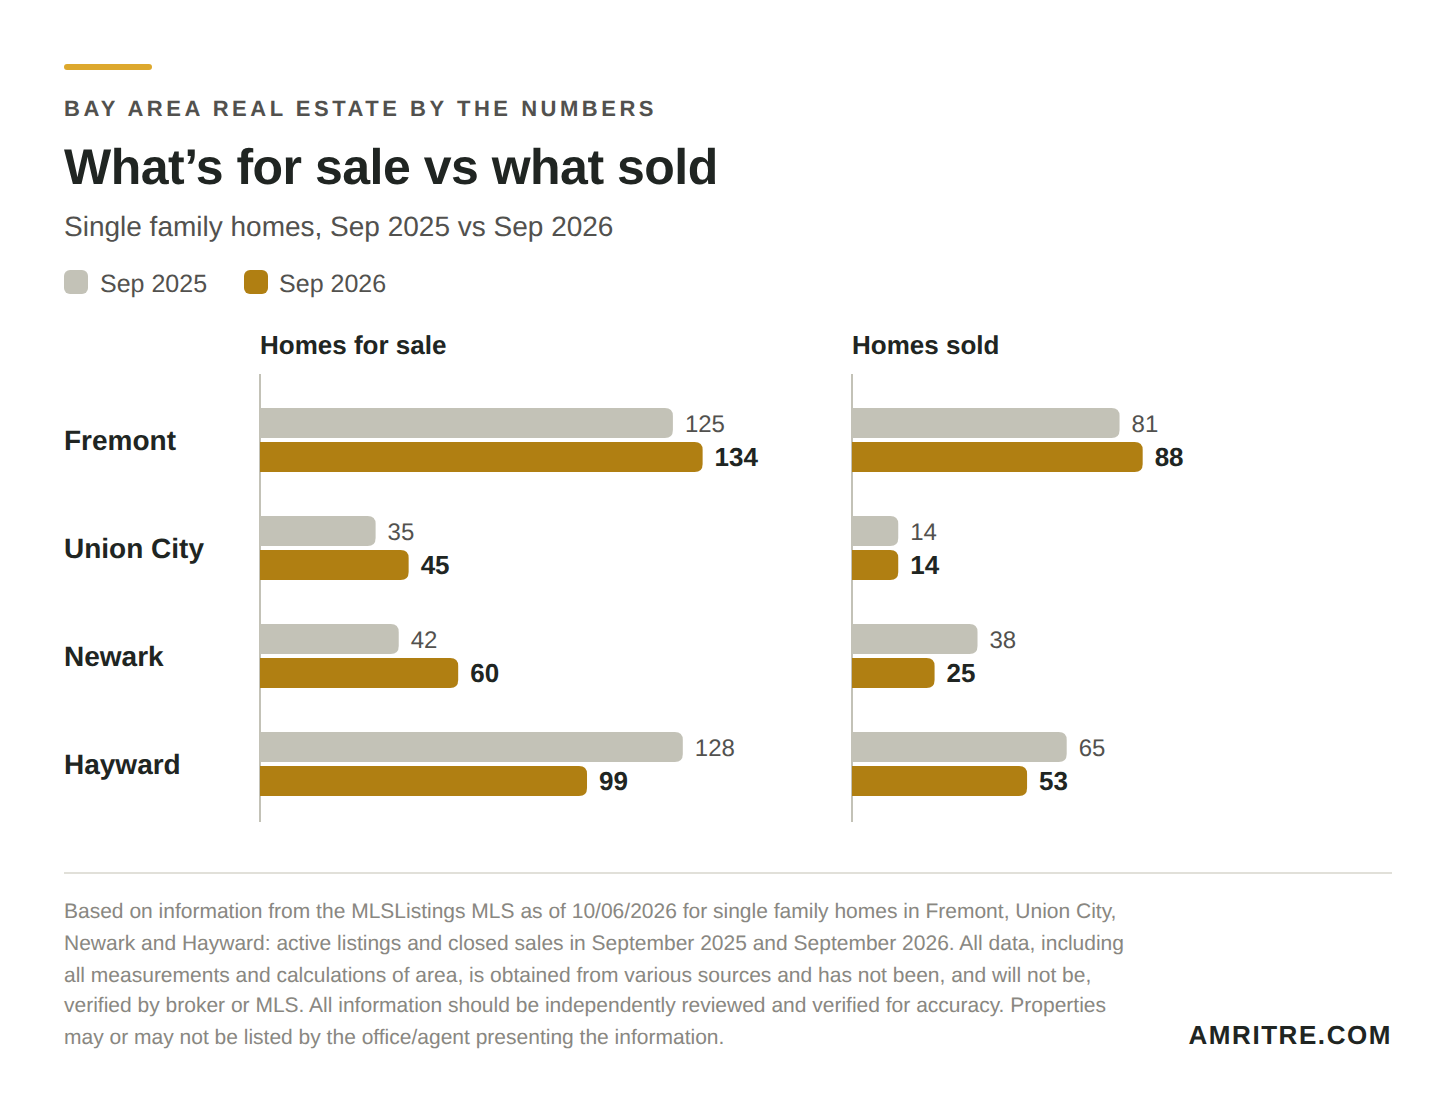
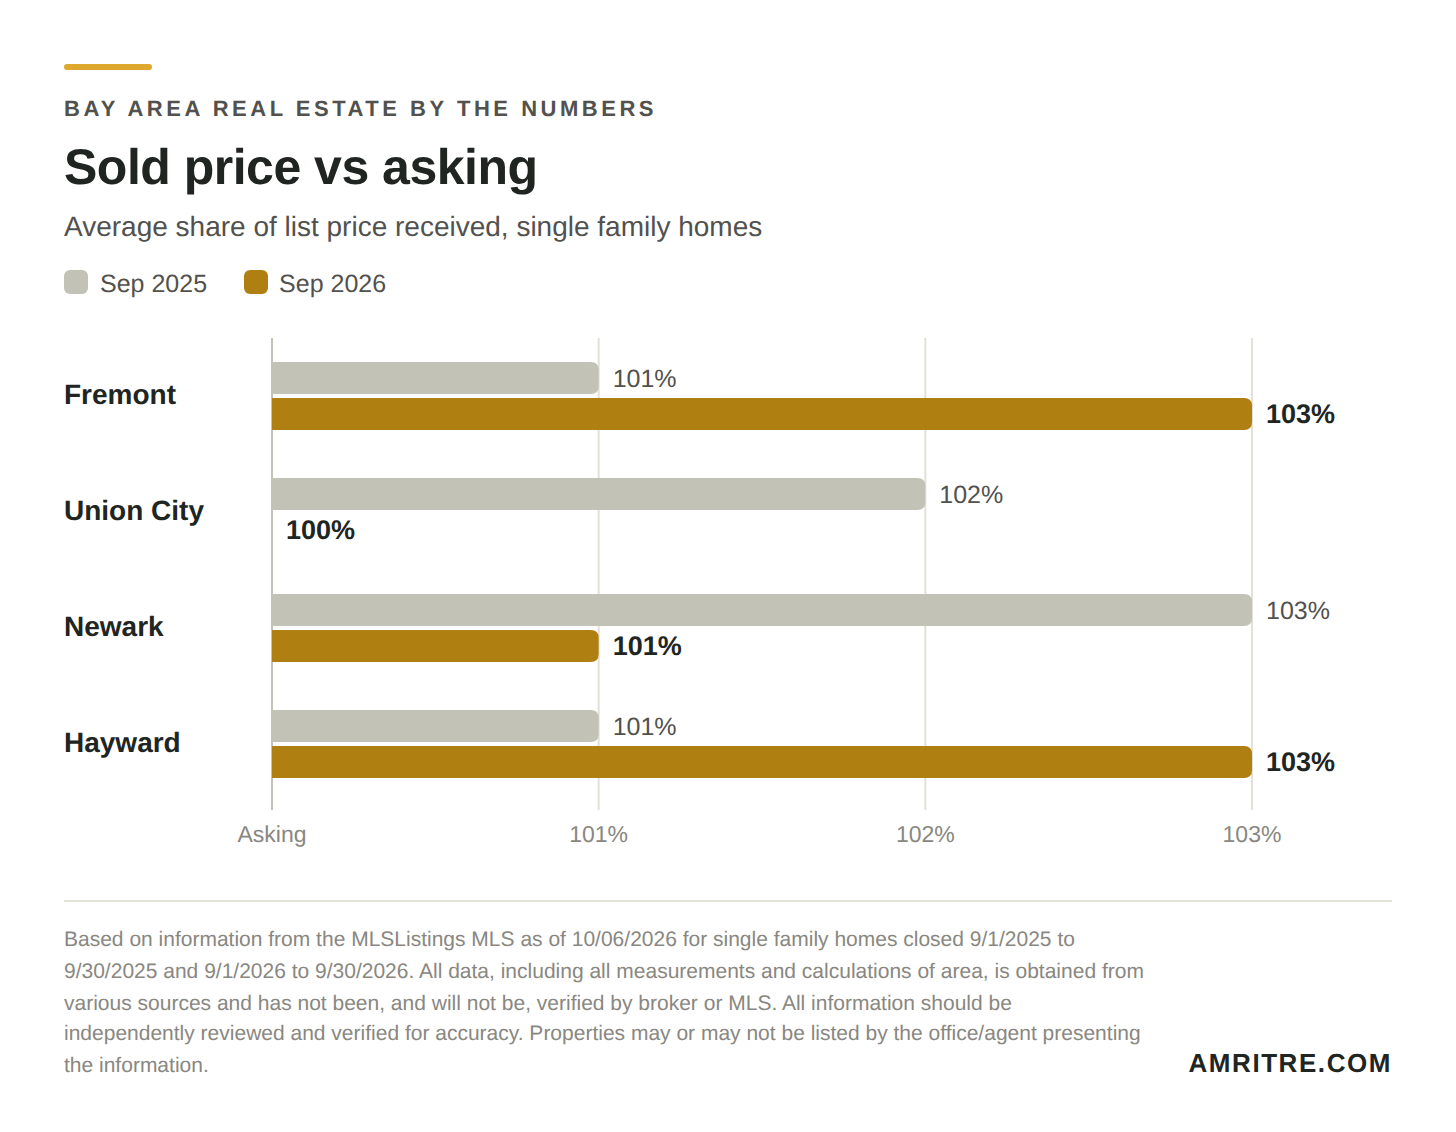
Fremont: 134 houses for sale and 88 sold in September, compared with 125 and 81 last September. That’s 1.5 months of supply, the same as a year ago. Median price $1.58M, down 5% from last September and up 1% from August. Houses sold for 103% of asking on average.
Union City: 45 houses for sale and 14 sold in September, compared with 35 and 14 last September. That’s 3.2 months of supply, up from 2.5 a year ago. Median price $1.40M, flat with last September and down 3% from August. Houses sold for 100% of asking on average.
Newark: 60 houses for sale and 25 sold in September, compared with 42 and 38 last September. That’s 2.4 months of supply, up from 1.1 a year ago. Median price $1.30M, down 3% from last September and down 12% from August. Houses sold for 101% of asking on average.
Hayward: 99 houses for sale and 53 sold in September, compared with 128 and 65 last September. That’s 1.9 months of supply, down from 2.0 a year ago. Median price $865K, up 2% from last September and down 5% from August. Houses sold for 103% of asking on average.
What jumped out
Days on market only tells you about the homes that sold
Half the houses that sold in Fremont went in 12 days or less. That’s real, and it’s the number everyone quotes. But across the four cities there were 338 houses for sale and 180 sales, compared with 330 and 198 a year ago. Buyers are moving fast on the right house and passing on the rest. That’s why I watch homes for sale against homes sold, not just how fast the sold ones went.
Newark flipped
A year ago Newark was the tightest of the four cities, with 1.1 months of supply. Now it’s 2.4. Houses for sale went from 42 to 60 while sales fell from 38 to 25. The median price is down 3% from last September. The 12% drop from August is mostly about which homes sold: price per square foot actually rose, from $753 to $816.
Fremont is selling more houses than last year, for a little less
Fremont had 88 sales vs 81 last September, at 103% of asking, and months of supply held at 1.5. But the median is 5% lower than last September and price per square foot is down 3% ($997 vs $1,028). Buyers will compete for a house that’s priced right. They aren’t paying last year’s prices.
Hayward is the quiet winner
Fewer houses for sale (99 vs 128) and fewer sales (53 vs 65), so the balance held. The median is up 2% from last September, the typical house sold in 16 days instead of 23, and buyers paid 103% of asking on average.
Condos and townhomes are the soft spot
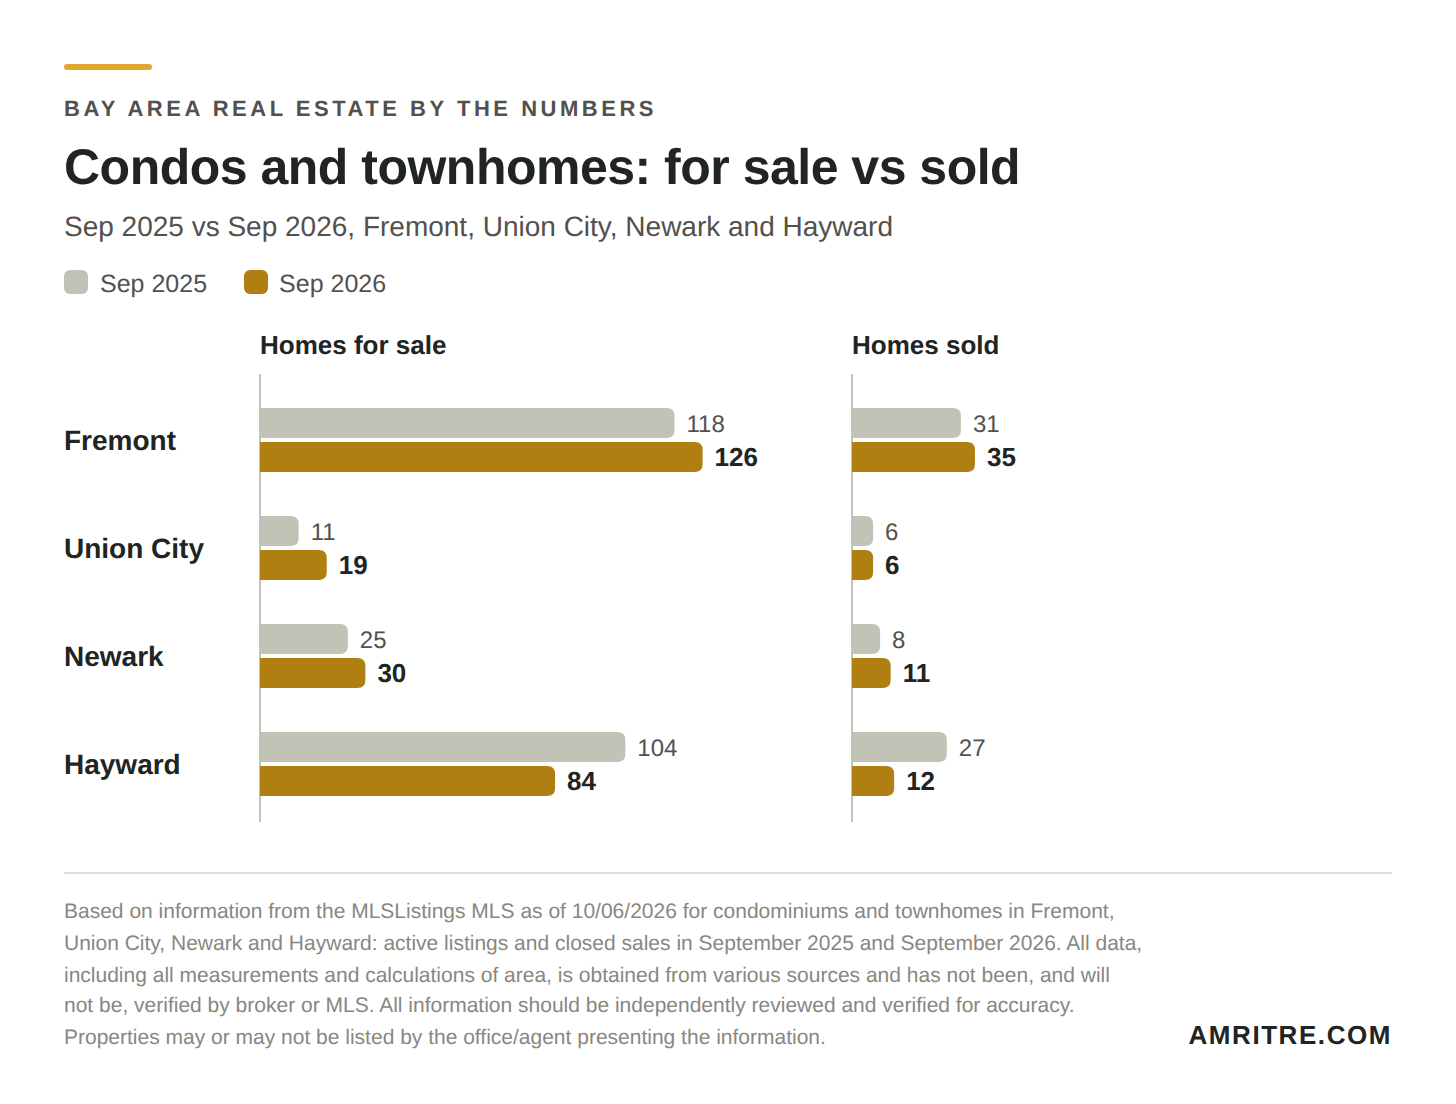
Across the four cities, 259 condos and townhomes were for sale in September, about the same as last year, but sales fell to 64 from 72. Hayward had 84 for sale and only 12 sales, about 7 months of supply. In Fremont the median condo or townhome sold for $675K, down from $830K last September, and price per square foot fell 11%. Union City and Newark had only 6 and 11 condo and townhome sales, so their medians bounce around.
If you’re thinking about selling
- Price it right from day one. Houses priced to the market are still going in about two weeks, at or over asking. When a house sits, price is almost always the reason.
- Your competition is the house down the street. Buyers have more houses to compare than any September in the last four years, so condition and presentation matter more than they did a year ago.
- In Newark and Union City, expect more competition than last year. In Fremont and Hayward, a well priced house can still sell over asking.
- If you own a condo or townhome, plan for a longer runway.
If you’re buying
- You have more houses to choose from than any September in the last four years.
- Well priced houses in Fremont and Hayward still sell over asking. When you find the right one, come in strong.
- Condos and townhomes, especially in Hayward, are where you have the most room to negotiate.
Homes for sale vs homes sold
Active listings and closed sales in September 2025 and September 2026. Months of supply is homes for sale divided by homes sold that month: how long it would take to sell everything on the market at that pace if nothing new got listed.
Single family homes
| City | For sale | Sold | Months of supply | |||
|---|---|---|---|---|---|---|
| 2025 | 2026 | 2025 | 2026 | 2025 | 2026 | |
| Fremont | 125 | 134 | 81 | 88 | 1.5 | 1.5 |
| Union City | 35 | 45 | 14 | 14 | 2.5 | 3.2 |
| Newark | 42 | 60 | 38 | 25 | 1.1 | 2.4 |
| Hayward | 128 | 99 | 65 | 53 | 2.0 | 1.9 |
| Total | 330 | 338 | 198 | 180 | 1.7 | 1.9 |
Condos and townhomes
| City | For sale | Sold | Months of supply | |||
|---|---|---|---|---|---|---|
| 2025 | 2026 | 2025 | 2026 | 2025 | 2026 | |
| Fremont | 118 | 126 | 31 | 35 | 3.8 | 3.6 |
| Union City | 11 | 19 | 6 | 6 | 1.8 | 3.2 |
| Newark | 25 | 30 | 8 | 11 | 3.1 | 2.7 |
| Hayward | 104 | 84 | 27 | 12 | 3.9 | 7.0 |
| Total | 258 | 259 | 72 | 64 | 3.6 | 4.0 |
Every September since 2023
Single family homes, Fremont, Union City, Newark and Hayward combined.
| Month | For sale | Sold | Months of supply |
|---|---|---|---|
| Sep 2023 | 182 | 189 | 1.0 |
| Sep 2024 | 265 | 190 | 1.4 |
| Sep 2025 | 330 | 198 | 1.7 |
| Sep 2026 | 338 | 180 | 1.9 |
Full numbers by city
Single family homes and condos or townhomes, Sep 2026 compared with Aug 2026 and Sep 2025. Median price and days on market are medians. % of asking is the average sold price as a share of list price. $ per sq ft is the average sold price per square foot.
Fremont
| Single family homes | Sep 2026 | Aug 2026 | Sep 2025 |
|---|---|---|---|
| Homes sold | 88 | 76 | 81 |
| Median price | $1.58M | $1.56M | $1.66M |
| Days on market | 12 | 14 | 15 |
| New listings | 103 | 119 | 94 |
| % of asking | 103% | 102% | 101% |
| $ per sq ft | $997 | $1,064 | $1,028 |
| Condos and townhomes | Sep 2026 | Aug 2026 | Sep 2025 |
|---|---|---|---|
| Homes sold | 35 | 31 | 31 |
| Median price | $675K | $736.5K | $830K |
| Days on market | 37 | 45 | 26 |
| New listings | 60 | 57 | 68 |
| % of asking | 99% | 99% | 100% |
| $ per sq ft | $616 | $604 | $693 |
Union City
| Single family homes | Sep 2026 | Aug 2026 | Sep 2025 |
|---|---|---|---|
| Homes sold | 14 | 20 | 14 |
| Median price | $1.40M | $1.44M | $1.41M |
| Days on market | 15 | 10 | 15 |
| New listings | 36 | 19 | 34 |
| % of asking | 100% | 101% | 102% |
| $ per sq ft | $731 | $765 | $848 |
| Condos and townhomes | Sep 2026 | Aug 2026 | Sep 2025 |
|---|---|---|---|
| Homes sold | 6 | 6 | 6 |
| Median price | $462.5K | $622.5K | $505K |
| Days on market | 28 | 35 | 32 |
| New listings | 12 | 6 | 9 |
| % of asking | 99% | 99% | 99% |
| $ per sq ft | $558 | $578 | $559 |
Newark
| Single family homes | Sep 2026 | Aug 2026 | Sep 2025 |
|---|---|---|---|
| Homes sold | 25 | 23 | 38 |
| Median price | $1.30M | $1.47M | $1.34M |
| Days on market | 13 | 25 | 12 |
| New listings | 36 | 35 | 37 |
| % of asking | 101% | 99% | 103% |
| $ per sq ft | $816 | $753 | $799 |
| Condos and townhomes | Sep 2026 | Aug 2026 | Sep 2025 |
|---|---|---|---|
| Homes sold | 11 | 9 | 8 |
| Median price | $930K | $755K | $621.9K |
| Days on market | 27 | 17 | 63 |
| New listings | 13 | 16 | 16 |
| % of asking | 100% | 100% | 98% |
| $ per sq ft | $541 | $563 | $537 |
Hayward
| Single family homes | Sep 2026 | Aug 2026 | Sep 2025 |
|---|---|---|---|
| Homes sold | 53 | 57 | 65 |
| Median price | $865K | $915K | $850K |
| Days on market | 16 | 16 | 23 |
| New listings | 72 | 77 | 87 |
| % of asking | 103% | 102% | 101% |
| $ per sq ft | $627 | $616 | $625 |
| Condos and townhomes | Sep 2026 | Aug 2026 | Sep 2025 |
|---|---|---|---|
| Homes sold | 12 | 22 | 27 |
| Median price | $604.5K | $534.5K | $610K |
| Days on market | 34 | 33 | 39 |
| New listings | 33 | 29 | 46 |
| % of asking | 99% | 99% | 98% |
| $ per sq ft | $453 | $445 | $462 |
Questions people ask
How many homes were for sale in Fremont in September 2026?
There were 134 single family homes for sale (active listings) in Fremont in September 2026, up from 125 in September 2025, based on MLSListings data. 88 sold in September, up from 81 a year earlier. That works out to about 1.5 months of supply.
Is it a buyer’s or seller’s market in Fremont, Union City, Newark and Hayward?
For single family homes it’s still a seller’s market by the usual rule of thumb of under about 4 months of supply. In September 2026 months of supply was 1.5 in Fremont, 1.9 in Hayward, 2.4 in Newark and 3.2 in Union City, up from 1.1 in Newark and 2.5 in Union City a year earlier. Condos and townhomes are softer, at about 7 months of supply in Hayward.
What was the median home price in Fremont in September 2026?
Single family homes in Fremont sold for a median of $1.58M in September 2026, based on MLSListings data. That was about 1% higher than August 2026 and about 5% lower than September 2025. Fremont condos and townhomes had a median of $675K.
What was the median home price in Union City in September 2026?
Single family homes in Union City sold for a median of $1.40M in September 2026, about 3% lower than August 2026 and flat with September 2025. 14 houses sold, the same as a year earlier, while houses for sale rose to 45 from 35.
What was the median home price in Newark in September 2026?
Single family homes in Newark sold for a median of $1.30M in September 2026, about 12% lower than August 2026 and 3% lower than September 2025. Price per square foot rose to $816 from $753 in August, which points to smaller homes selling in September rather than falling values. Houses for sale rose to 60 from 42 a year earlier, while sales fell to 25 from 38.
What was the median home price in Hayward in September 2026?
Single family homes in Hayward sold for a median of $865K in September 2026, about 5% lower than August 2026 and 2% higher than September 2025. Houses sold for 103% of list price on average, and there were 99 houses for sale, down from 128 a year earlier.
Are homes still selling over asking in the East Bay?
For houses, yes. In September 2026, single family homes sold for an average of 103% of list price in Fremont and Hayward, 101% in Newark and 100% in Union City. Condos and townhomes sold for 99% to 100% of list price.
Why isn’t days on market enough to judge the market?
Days on market only counts the homes that sold. If fewer homes sell while more sit, days on market can still look fast. Comparing homes for sale with homes sold, or months of supply, shows the full picture. In September 2026 the four cities had 338 houses for sale and 180 sales, compared with 330 and 198 a year earlier.
WHERE DOES YOUR HOME LAND?
Get your home’s value from Amrit, based on your actual comps, not an online estimate
Based on information from the MLSListings MLS as of 10/06/2026 for single family homes and condominiums/townhomes in Fremont, Union City, Newark and Hayward: closed sales 9/1/2026 to 9/30/2026, 8/1/2026 to 8/31/2026 and 9/1/2025 to 9/30/2025, and active listings and closed sales in September 2023, 2024, 2025 and 2026. All data, including all measurements and calculations of area, is obtained from various sources and has not been, and will not be, verified by broker or MLS. All information should be independently reviewed and verified for accuracy. Properties may or may not be listed by the office/agent presenting the information. Percent changes are calculated from the rounded medians shown.