By Amrit Singh, REALTOR® · The Oberoi Group at Intero Real Estate · Published October 29, 2026 · MLS data as of 10/29/2026
If this summer felt slow to you, you weren’t imagining it.
I pulled every home that sold in Alameda, Santa Clara, Marin and San Francisco counties this spring and summer, and put it next to the same months last year. Then I zoomed in on Fremont, Union City, San Jose, Menlo Park, Palo Alto, Los Altos, Los Altos Hills, Atherton, Hillsborough and Sausalito.
Here’s the story in three numbers. This spring, those four counties sold 8,940 homes, 7% more than last spring. Then summer hit and sales fell to 7,547. That is the exact same number as last summer. Spring got everyone’s hopes up. Summer gave it all back.
THE SHORT ANSWER
Buyers pulled back hard. Sales fell 16% from spring to summer this year, versus 10% last year.
Prices mostly held. Suburban single family prices per square foot are flat to slightly up from last summer. Townhomes and condos are down 3% to 7%.
The top of the market kept climbing. San Francisco, Palo Alto, Atherton and Hillsborough are up double digits.
Buyers pulled back harder this summer
Sales always slow from spring to summer. This year they slowed a lot more.
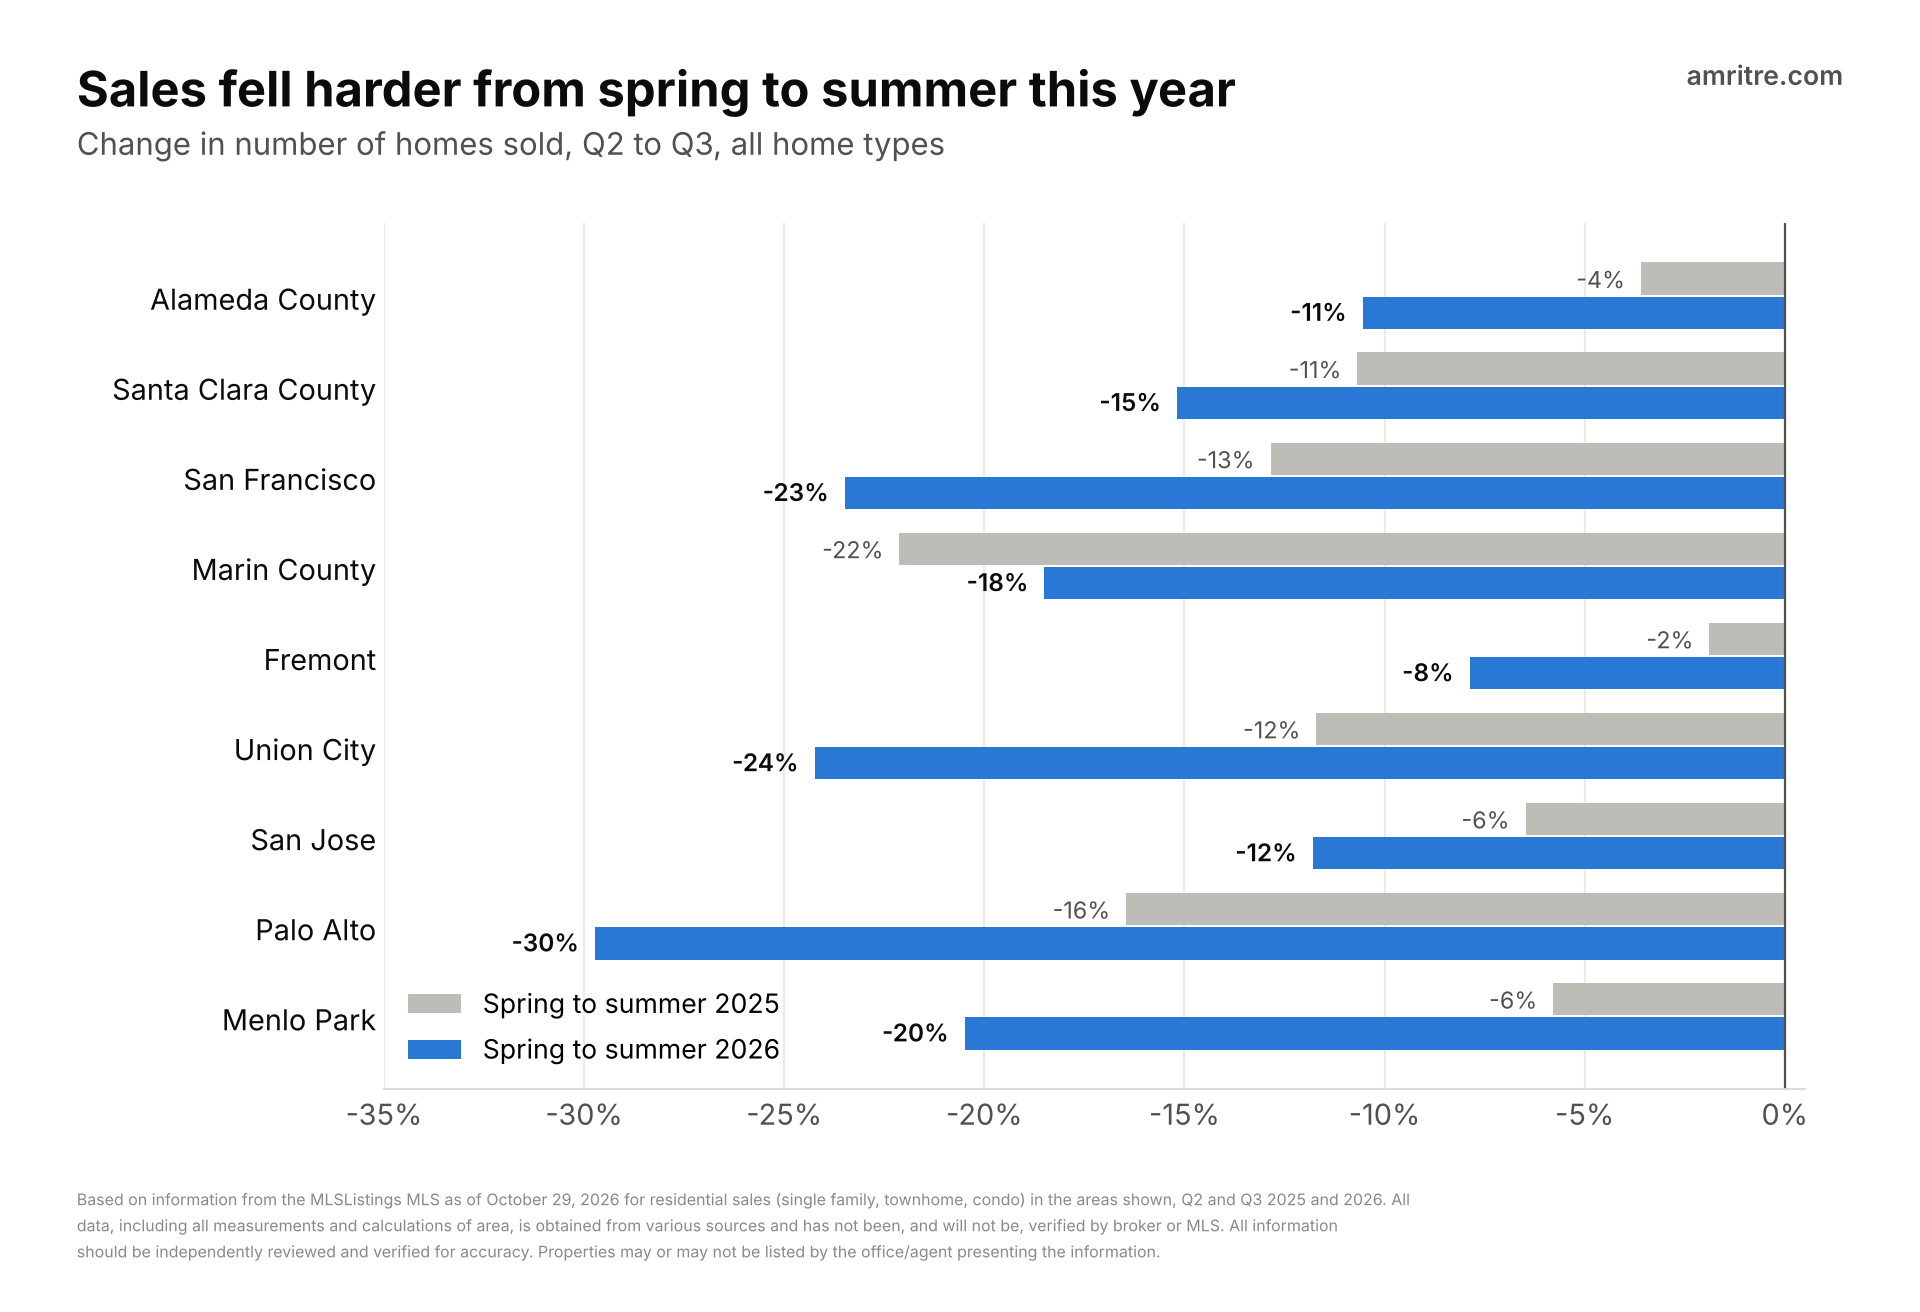
Alameda County sales fell 11% from spring to summer, almost three times last year’s 4% dip. Union City fell 24%, double last year. Palo Alto fell 30%. Menlo Park fell 20%, versus 6% last year. Marin was the only area that slowed less than last year.
That’s fewer buyers writing offers, plain and simple.
So why didn’t prices drop?
Because these numbers only count homes that sold. A seller who wouldn’t come down didn’t sell, and that home isn’t in here. The homes that did sell were mostly priced right, so the price per square foot held up. The weakness shows up in how many homes sold, not what they sold for.
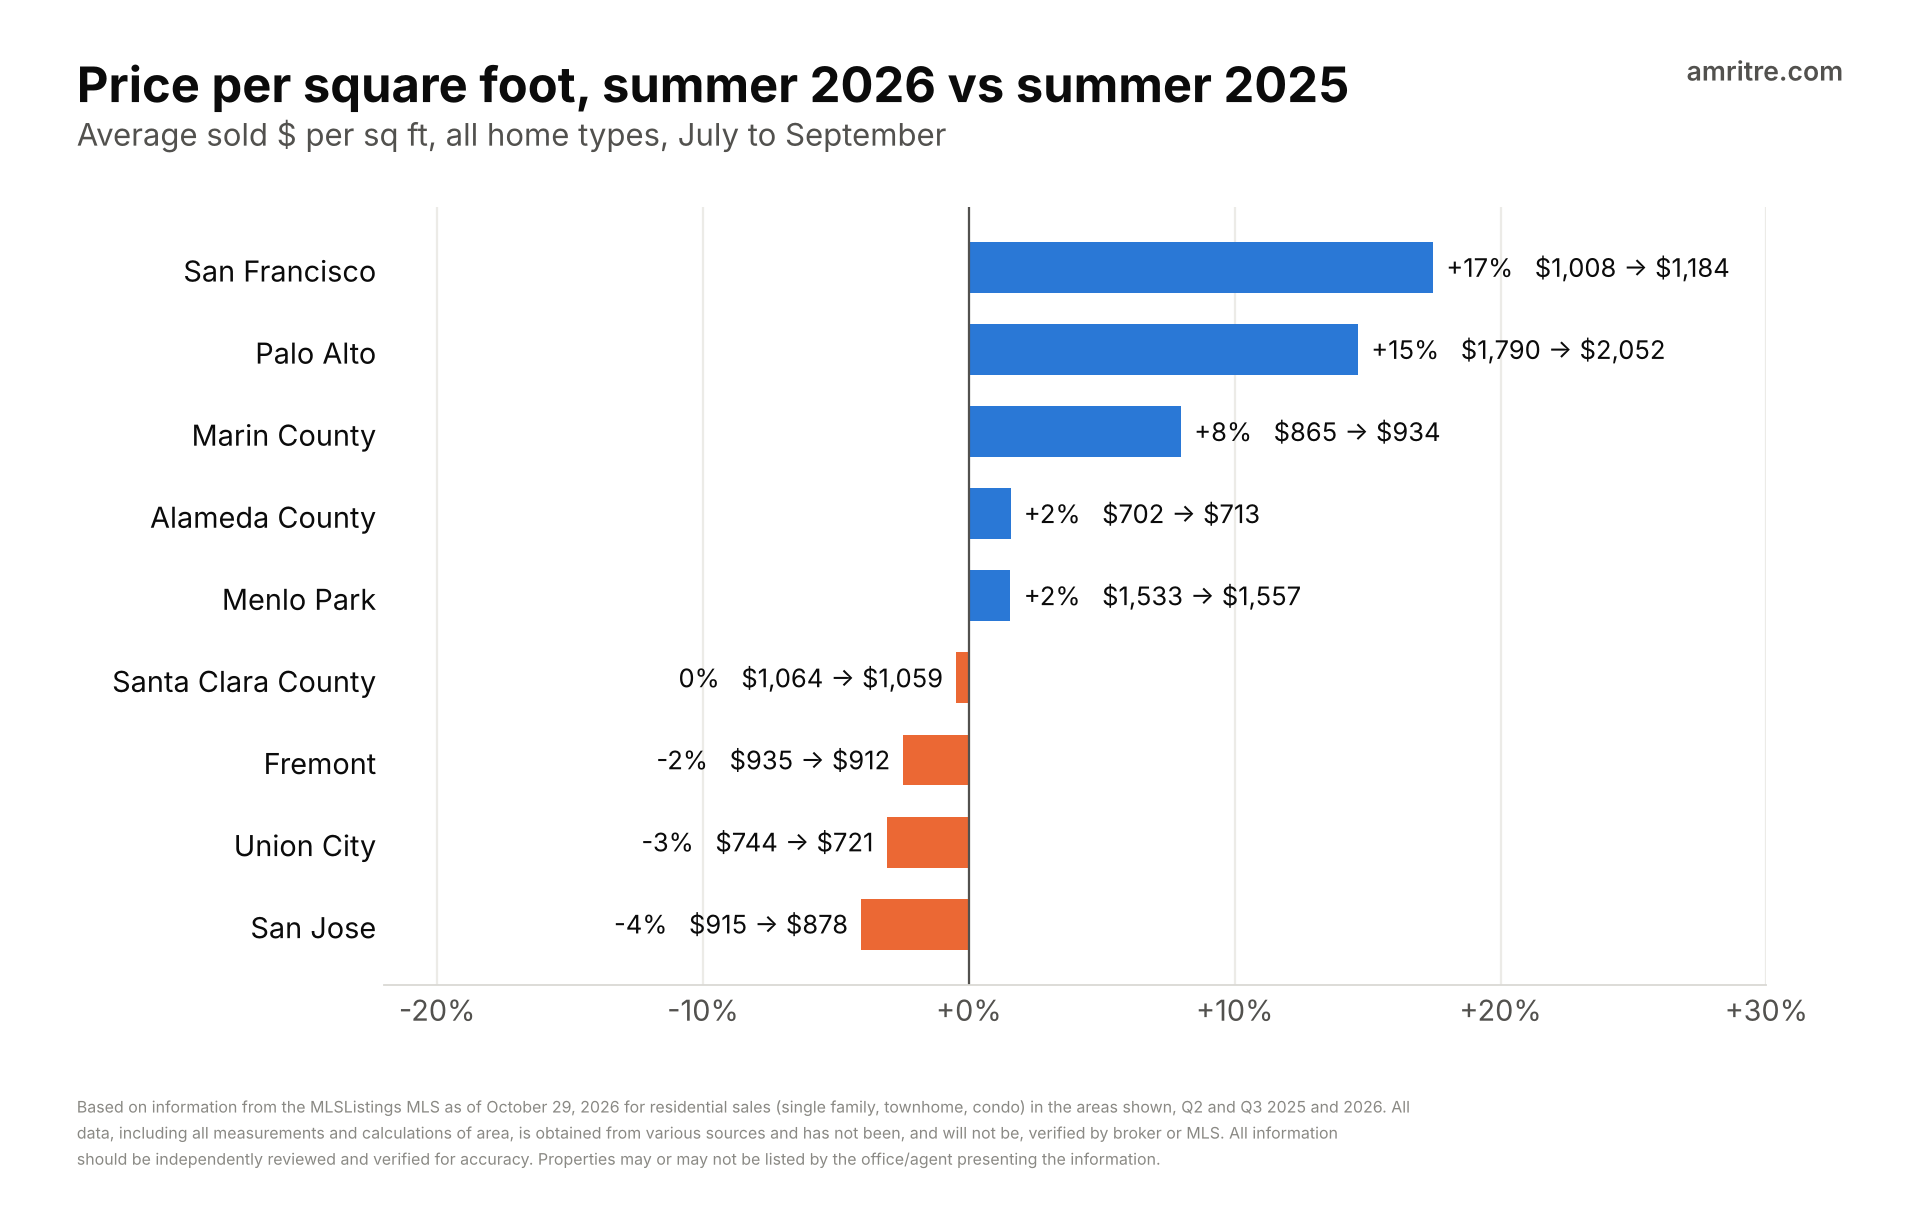
I use average sold price per square foot instead of the median, because the median jumps around with the mix of homes that sold. Alameda County went from $702 to $713 a square foot. Santa Clara County went from $1,064 to $1,059. Fremont, Union City and San Jose are 2% to 4% lower than last summer.
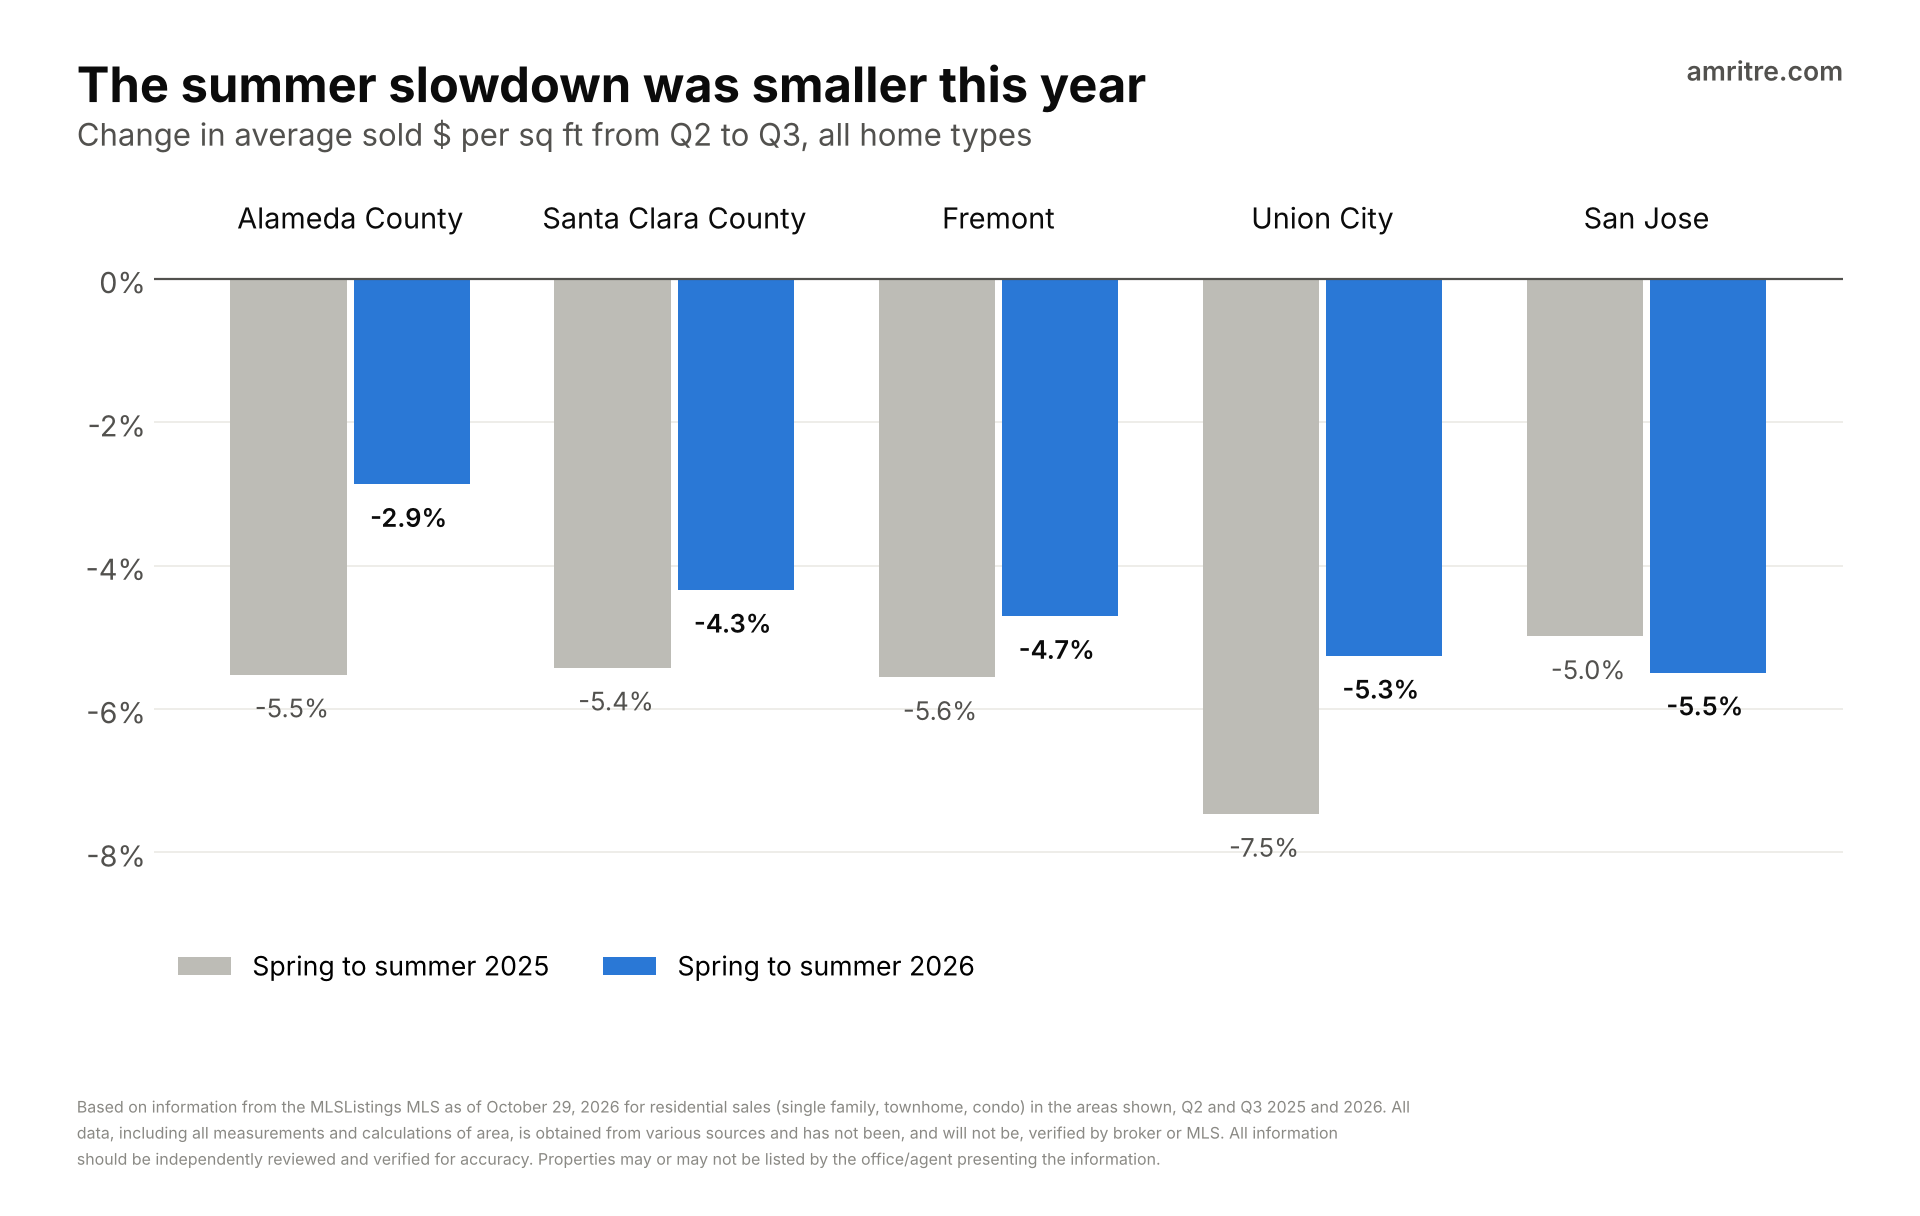
Prices also eased less from spring to summer than they did last year. Alameda dipped 2.9% this year versus 5.5% last year. San Jose is the exception, slightly worse at 5.5% versus 5.0%.
Single family is holding. Townhomes and condos are not.
The market split by home type, and one headline number hides it.
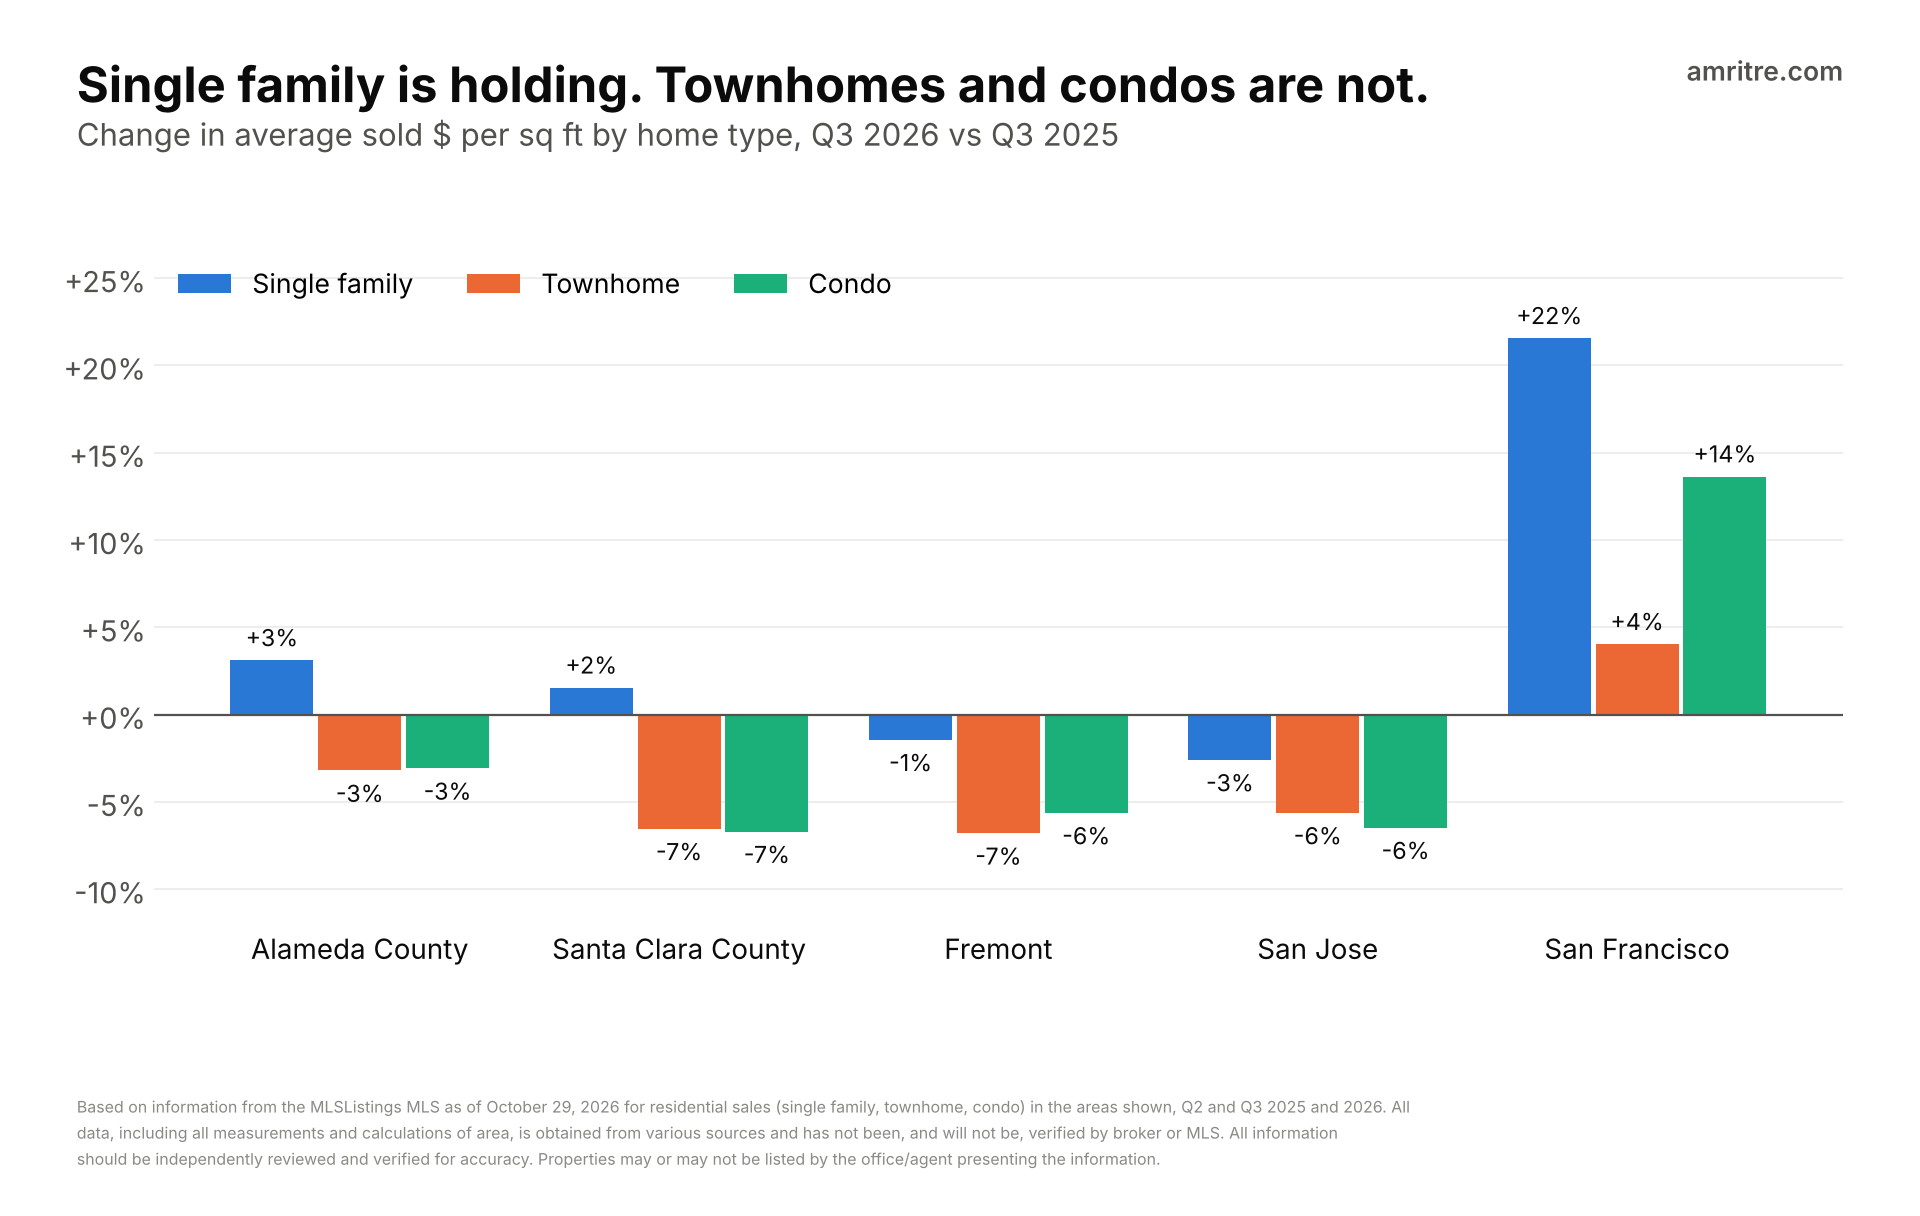
Single family in Alameda County is up 3% per square foot ($741 to $764). Santa Clara single family is up 2% ($1,176 to $1,194). Meanwhile Santa Clara townhomes and condos are both down 7%. Fremont townhomes are down 7% and condos 6%. San Jose is down 6% for both.
My take: the buyers who are still out there are stretching for land and a yard. Townhomes and condos are competing with each other for fewer buyers, and HOA dues make the monthly math harder.
The top of the market kept climbing
Fewer homes sold at the high end too. But the ones that did sold for a lot more.
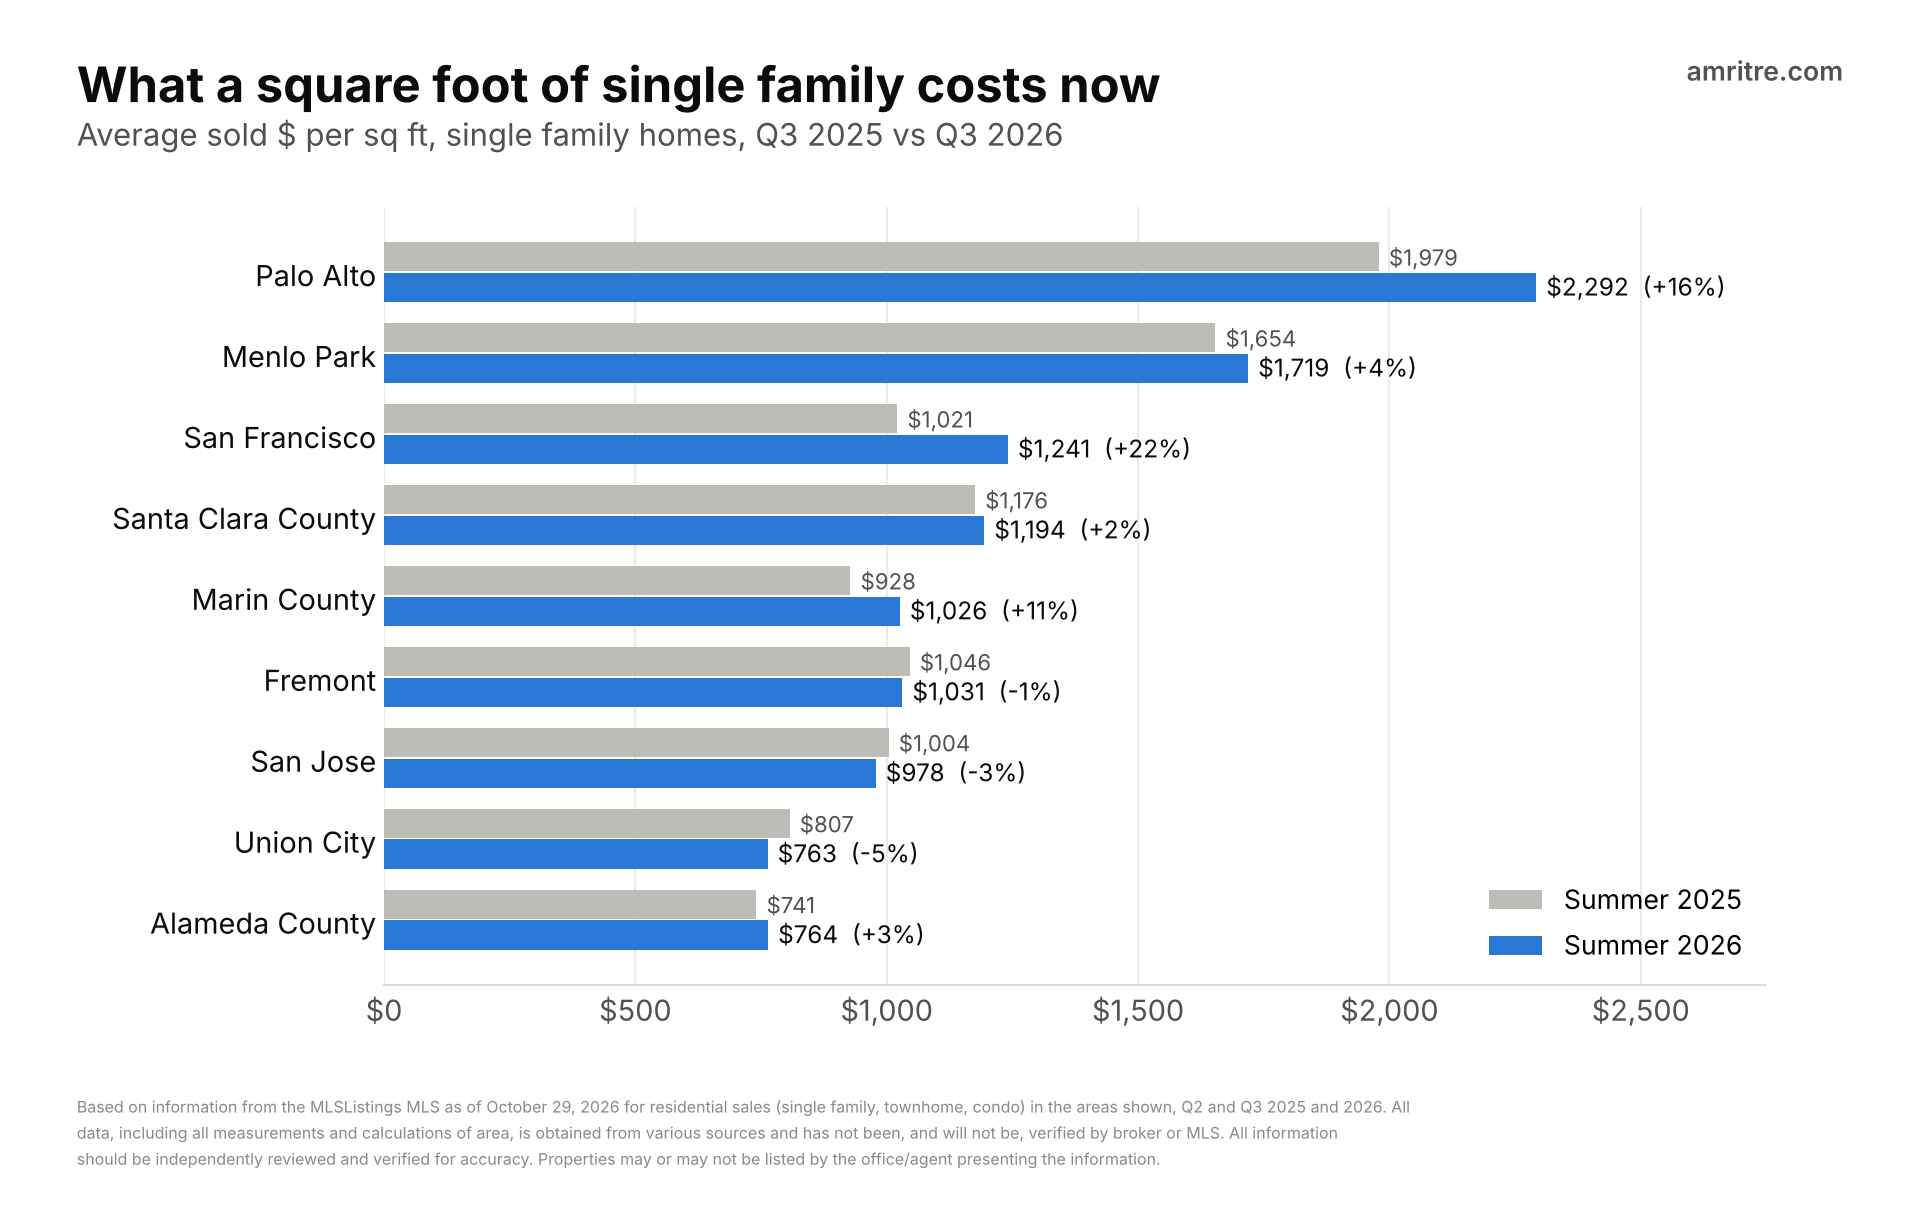
San Francisco single family went from $1,021 to $1,241 a square foot, up 22%. Its median single family home went from $1.61 million to $2 million.
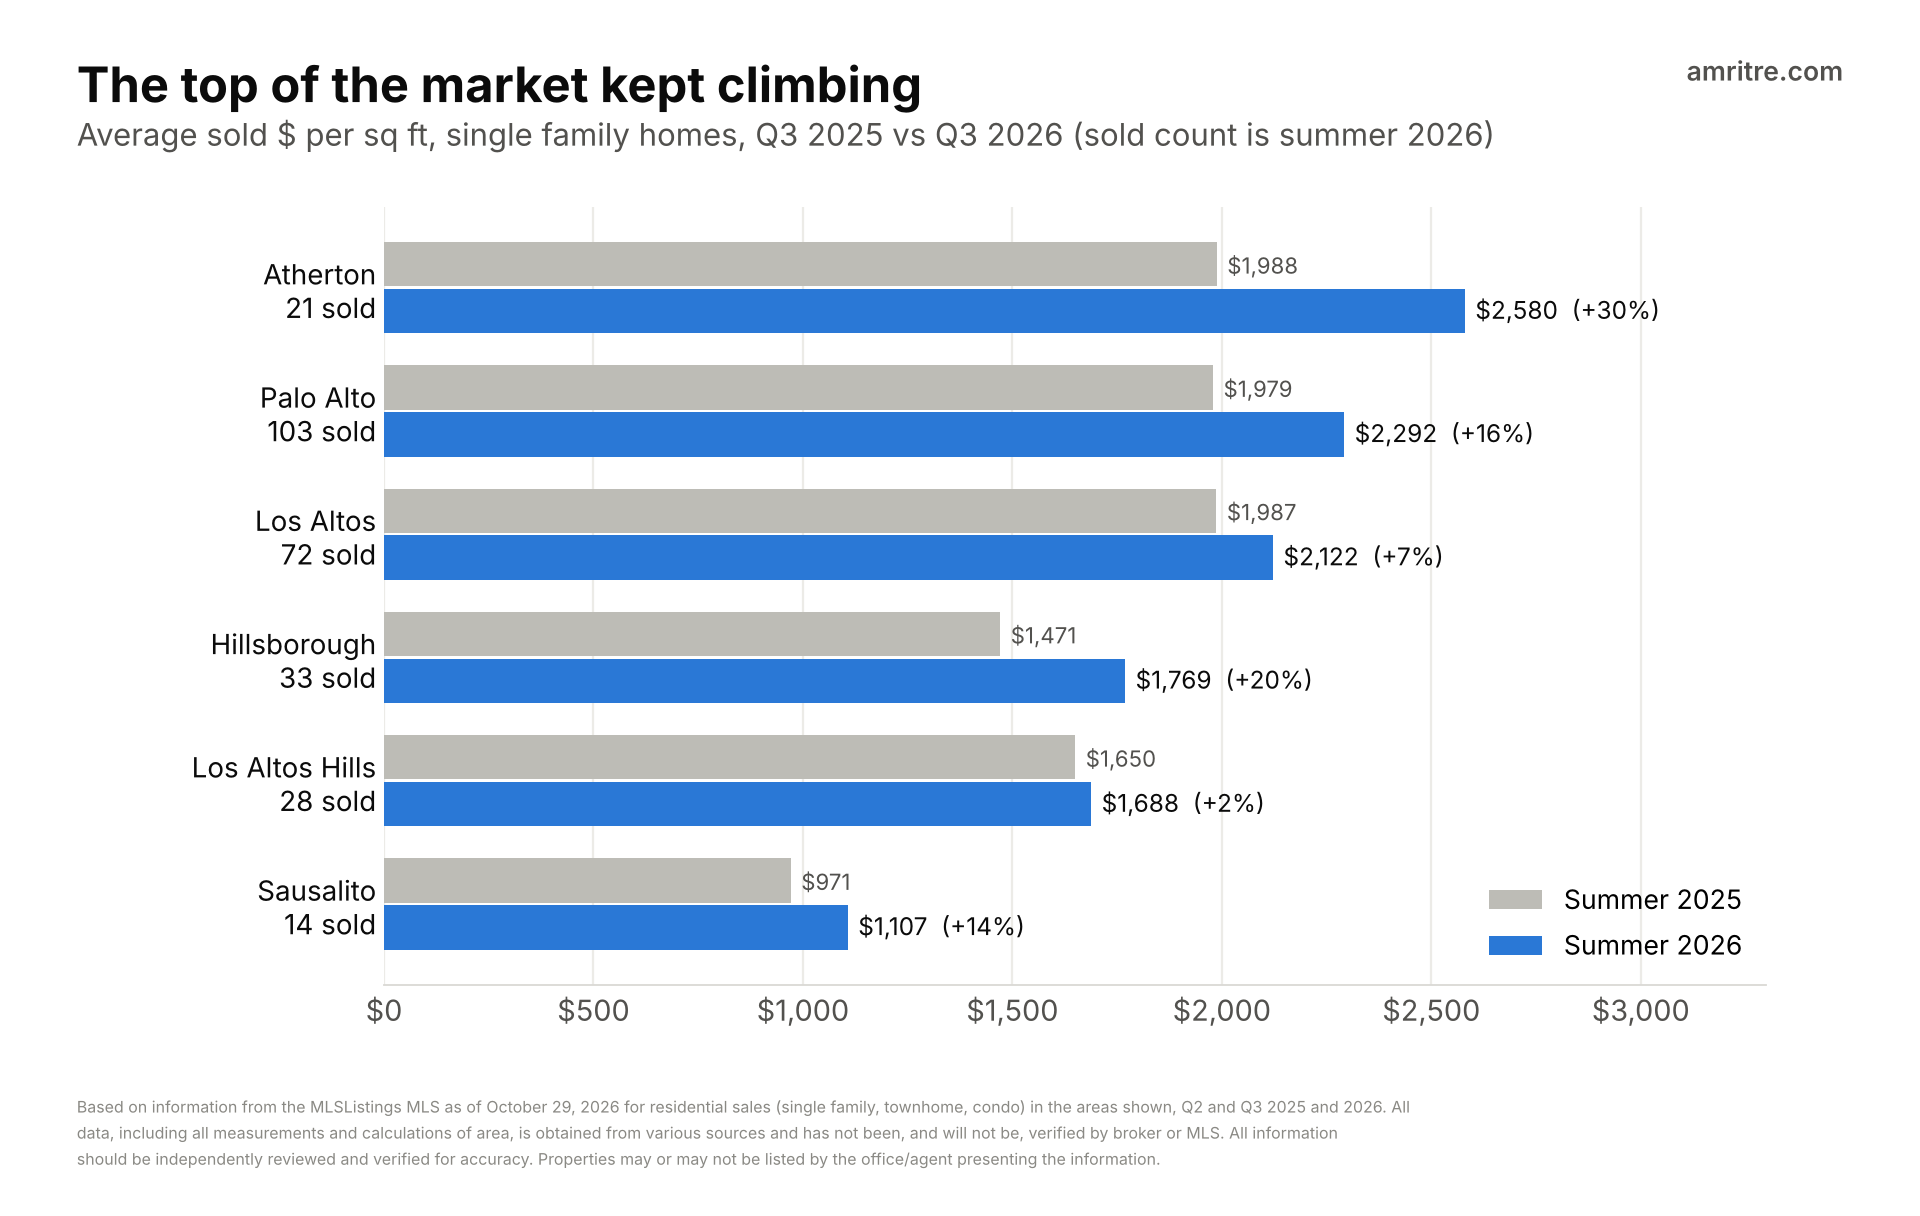
Atherton single family is up 30% to $2,580 a square foot. Hillsborough is up 20%. Palo Alto is up 16% to $2,292. Los Altos is up 7%, Los Altos Hills 2%. Sausalito is up 14%. These towns sell very few homes (Atherton sold 21 single family homes this summer, Sausalito 14), so one big sale can move the number. The direction is still clear.
All the numbers
Summer (July to September), all home types, 2025 vs 2026.
| Area | Sold 2025 | Sold 2026 | Median 2025 | Median 2026 | $/sq ft 2025 | $/sq ft 2026 | $/sq ft change |
|---|---|---|---|---|---|---|---|
| Alameda County | 2,710 | 2,587 | $1.06M | $1.08M | $702 | $713 | up 2% |
| Santa Clara County | 3,028 | 2,943 | $1.61M | $1.56M | $1,064 | $1,059 | 0% |
| Marin County | 595 | 727 | $1.43M | $1.52M | $865 | $934 | up 8% |
| San Francisco | 1,214 | 1,290 | $1.35M | $1.53M | $1,008 | $1,184 | up 17% |
| Fremont | 365 | 351 | $1.47M | $1.37M | $935 | $912 | down 2% |
| Union City | 83 | 75 | $1.22M | $1.25M | $744 | $721 | down 3% |
| San Jose | 1,516 | 1,488 | $1.40M | $1.35M | $915 | $878 | down 4% |
| Menlo Park | 114 | 97 | $2.88M | $3.20M | $1,533 | $1,557 | up 2% |
| Palo Alto | 132 | 130 | $3.62M | $3.80M | $1,790 | $2,052 | up 15% |
| Los Altos | 87 | 86 | $4.02M | $4.69M | $1,918 | $1,992 | up 4% |
| Los Altos Hills | 31 | 28 | $5.62M | $6.62M | $1,650 | $1,688 | up 2% |
| Atherton | 16 | 21 | $7.76M | $12.25M | $1,988 | $2,580 | up 30% |
| Hillsborough | 31 | 33 | $5.12M | $6.60M | $1,471 | $1,769 | up 20% |
| Sausalito | 29 | 35 | $1.75M | $1.24M | $936 | $962 | up 3% |
So, did we hit bottom?
Not cleanly. Buyers stepped back this summer, but sellers didn’t cave. Prices held because the homes that weren’t priced right just didn’t sell. Something has to give: either buyers come back in the spring, or sellers who need to move start cutting.
For single family in Alameda and Santa Clara counties, I think prices are at or near their floor. For townhomes and condos, not yet.
Here is what I’d do with that:
- Buying single family? Waiting for a big drop is a bet these numbers don’t support. But with fewer buyers around, you have room to negotiate terms.
- Buying a townhome or condo? You have leverage. Use recent sales, not list prices, to set your offer.
- Selling anything this winter? Price to what sold in the last 90 days, not what your neighbor got last spring. The homes that sat this summer were the ones priced for a market that already left.
WHAT DOES THIS MEAN FOR YOUR HOME?
City numbers only go so far. Your street is its own market. Text me your address and I’ll pull what homes like yours actually sold for this summer.
Questions people ask
Did Bay Area home sales slow down in summer 2026?
Yes. Across Alameda, Santa Clara, Marin and San Francisco counties, sales fell 16% from spring (April to June) to summer (July to September) 2026, versus 10% in 2025. Alameda County fell 11% versus 4%, Union City 24% versus 12% and Palo Alto 30% versus 16%.
Did Bay Area home prices drop in summer 2026?
Mostly not. Average sold price per square foot was $713 in Alameda County, up 2% from summer 2025, and $1,059 in Santa Clara County, flat. Fremont, Union City and San Jose were 2% to 4% lower. Townhomes and condos fell more than single family homes.
Why didn’t prices fall if fewer homes sold?
Sold prices only count homes that sold. Sellers who would not lower their price did not sell, so those homes are not in the numbers. The slowdown shows up in how many homes sold, not in what they sold for.
Have Bay Area home prices hit bottom?
For single family homes in Alameda and Santa Clara counties, prices are flat to slightly up from last summer and eased less from spring to summer than in 2025, which points to a floor. Townhomes and condos were still 3% to 7% lower per square foot.
Based on information from the MLSListings MLS as of 10/29/2026 for residential sales (single family, townhome and condo) in Alameda, Santa Clara, Marin and San Francisco counties and the cities of Fremont, Union City, San Jose, Menlo Park, Palo Alto, Los Altos, Los Altos Hills, Atherton, Hillsborough and Sausalito, for April to June and July to September of 2025 and 2026. All data, including all measurements and calculations of area, is obtained from various sources and has not been, and will not be, verified by broker or MLS. All information should be independently reviewed and verified for accuracy. Properties may or may not be listed by the office/agent presenting the information. Percent changes are calculated from the full figures before rounding.