By Amrit Singh, REALTOR® · The Oberoi Group at Intero Real Estate · Published October 14, 2026 · MLS data as of 10/13/2026
Almost every buyer I talk to asks me the same question: when is the crash?
Here’s my answer. In the middle of the Bay Area, it already happened. Not in prices. In payments.
At the top, the opposite is happening. Put the two side by side and you get a K: one line going up, one going down.
Two Bay Areas
I pull the same MLS numbers every month for 14 Bay Area cities. Here’s how the median single family home price moved from January through September 2026, compared with the same months of 2025.
At the top:
- Atherton: up 33%, to $11.65M
- Menlo Park: up 8%, to $3.58M
- Palo Alto: up 6%, to $4.13M
- Los Altos: up 1%, to $4.92M, with price per square foot up 8%
In the middle:
- Santa Clara: down 6%, to $1.91M
- Fremont, Union City and Milpitas: down 3%, to $1.70M, $1.41M and $1.63M
- Pleasanton: down 2%, to $1.68M
- Newark and Hayward: flat, at $1.40M and $915.5K
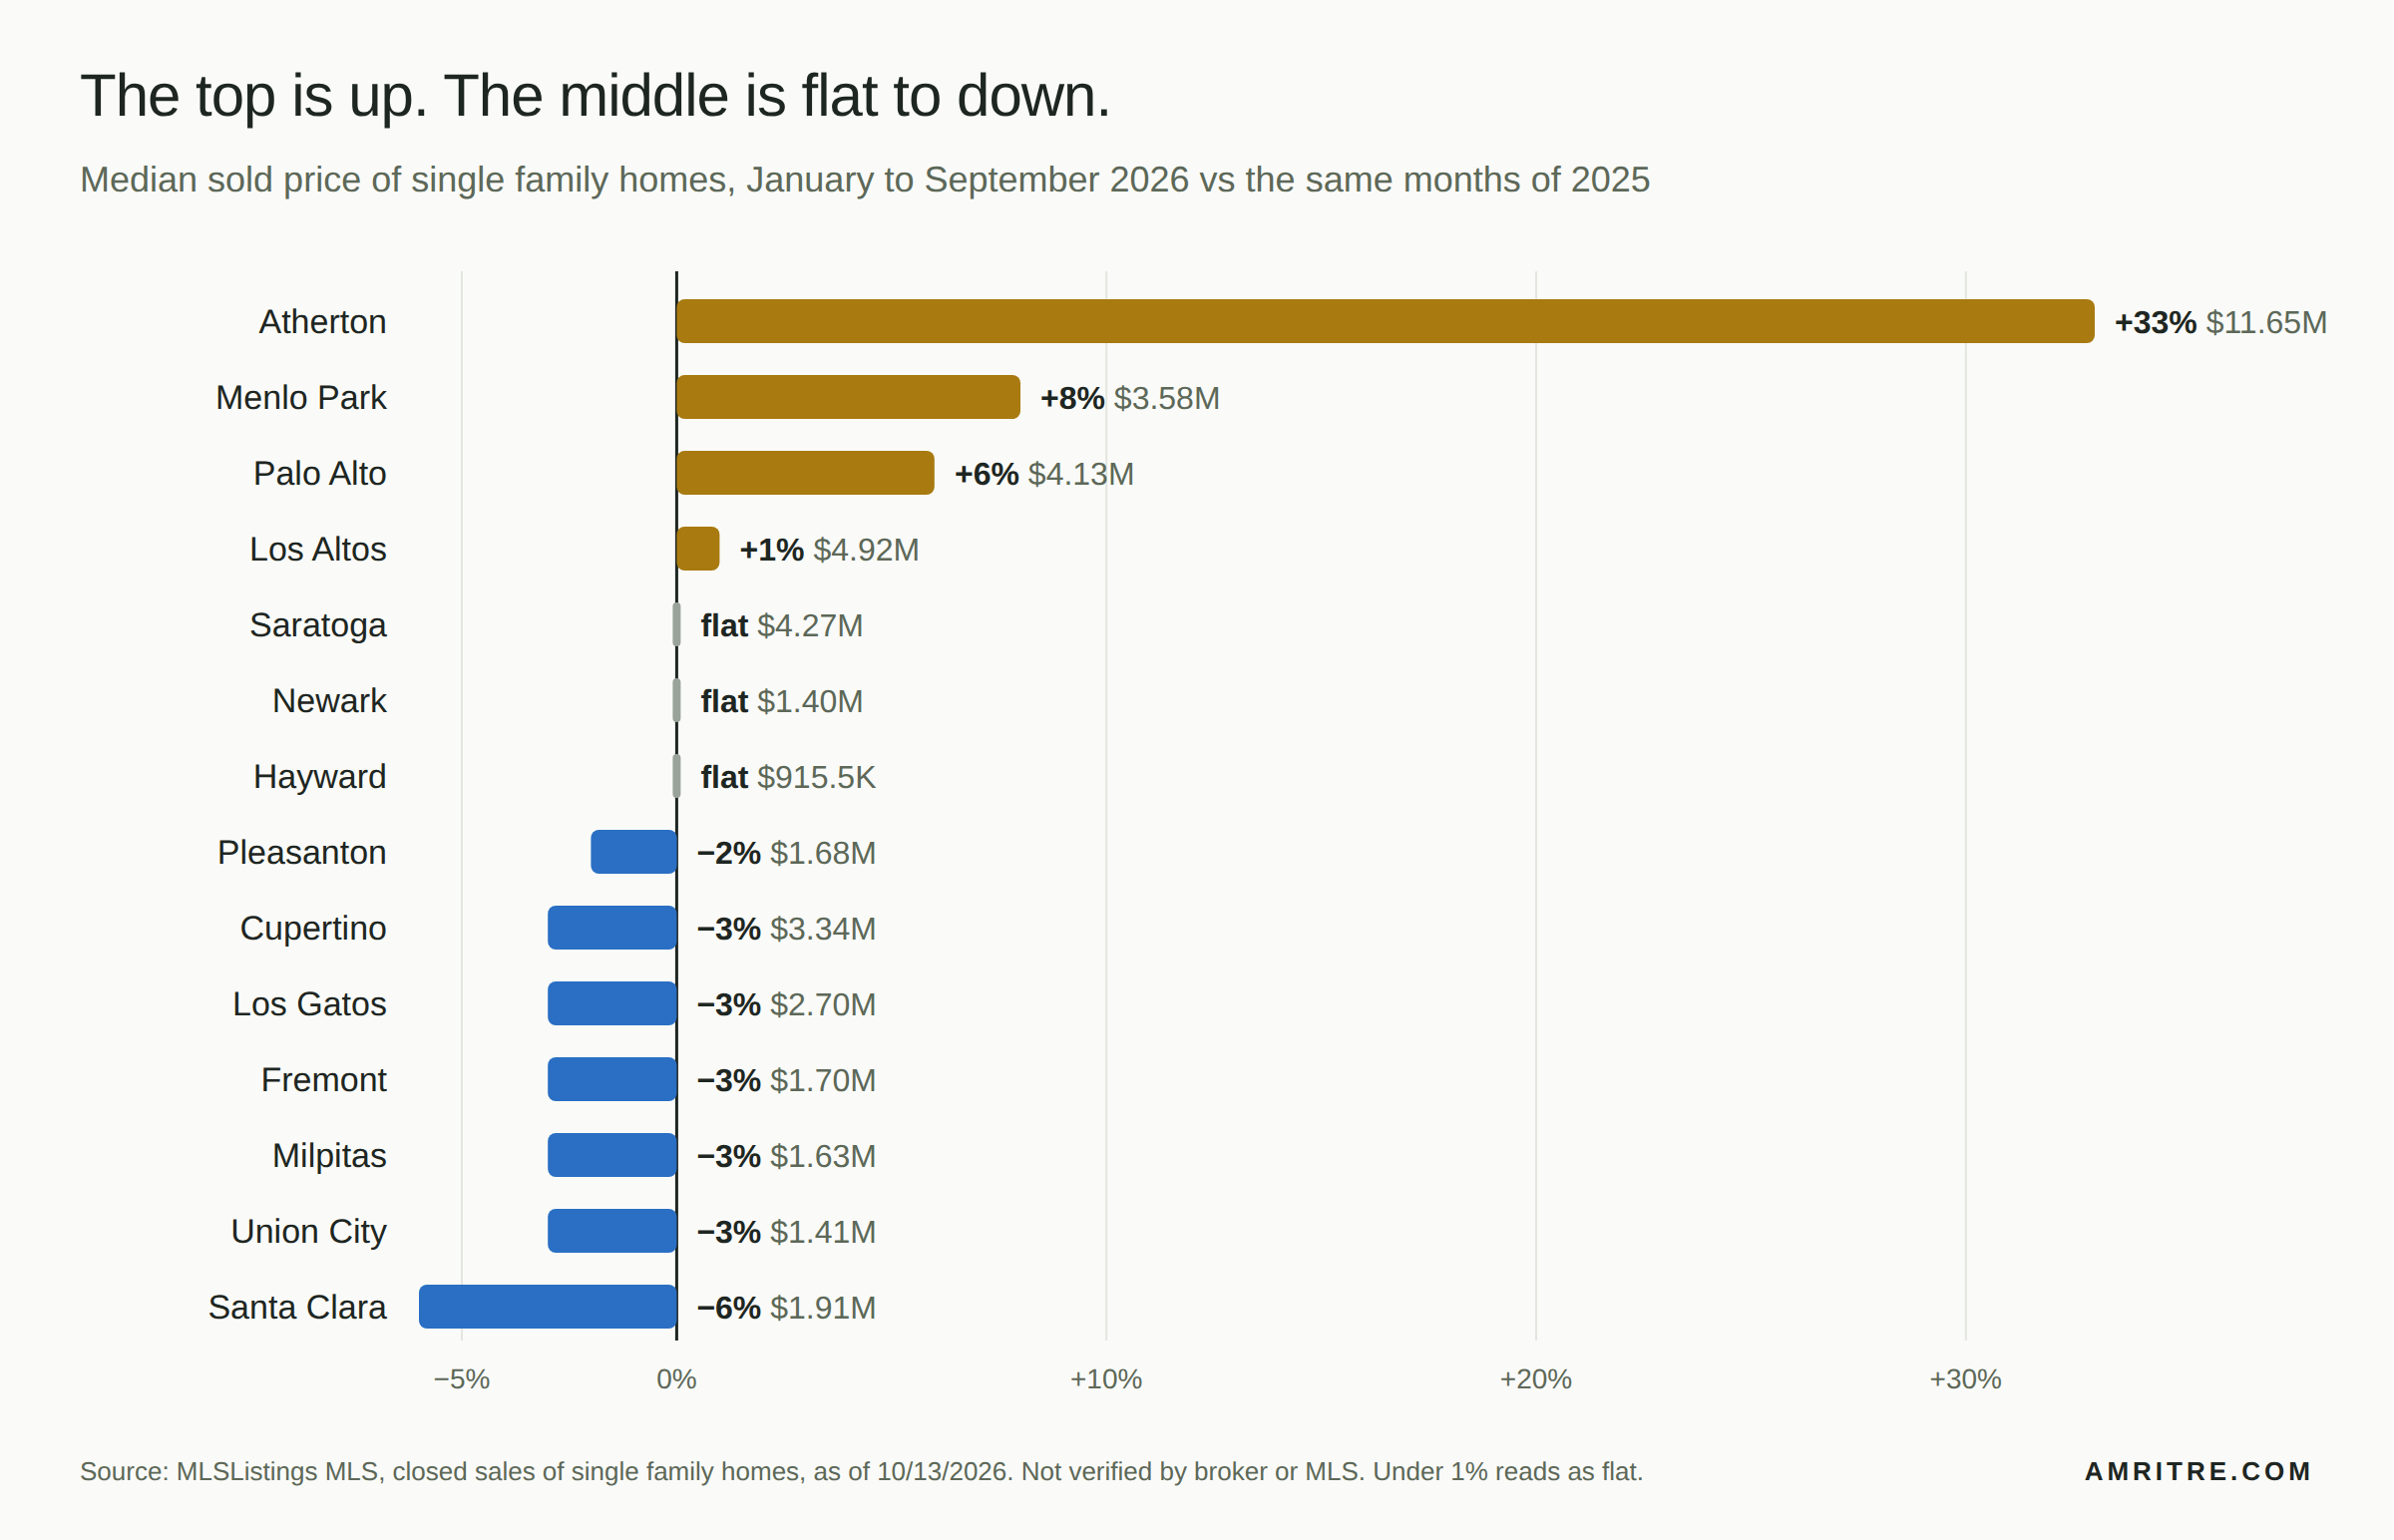
It isn’t a perfect split by price. Cupertino and Los Gatos are down 3% too, and Saratoga is flat. But all four Peninsula cities, the priciest per square foot on my list, are up, and every East Bay city is flat or down.
Same Bay Area, same interest rates, two different markets. Palo Alto houses sold for 107.8% of asking on average this year, the most of any city I track. Pleasanton houses sold for 99.9%.
Why the top is booming
It’s not a mystery. It’s AI money.
- In September, the Associated Press reported that affluent buyers, many of them working at AI companies, are buying multimillion dollar homes in the Bay Area despite higher rates. In the San Francisco metro area, luxury home sales were up 39.3% in the first half of 2026, according to Redfin, vs 15.1% for the middle of the market. In Oakland it was 13.3% vs 3.9%.
- OpenAI and Anthropic filed preliminary paperwork for IPOs in June. Redfin estimated their employees’ IPO money could buy nearly a third of all the homes in San Francisco.
- It’s not only here. Nationally, Redfin found luxury home prices up 4.7% and the rest of the market up 1.5% in the three months through May.
When you’re buying with stock money and a big down payment, the mortgage rate is a detail. As Redfin’s chief economist told the AP: “They want the home they want and they have the money to buy it.”
Why the middle already crashed
The middle didn’t crash in price. It crashed in affordability.
- Rates. Freddie Mac’s average 30 year rate was 7.4% on October 8, up for the seventh week in a row, the highest in nearly 3 years. A year ago it was 6.3%.
- Payments. Take the typical Union City house, $1.41M, with 20% down. At 7.4%, principal and interest is about $7,810 a month. At last October’s 6.3%, it was about $6,980. Same house, about $830 more every month. At the 3% rates of 2021, it was about $4,760.
- First time buyers. They made up 21% of buyers in the 2025 Profile of Home Buyers and Sellers from the National Association of REALTORS®, a record low. Their median age hit 40, a record high.
- Sales. House sales in the seven middle cities I track are down 6% this year, led by Pleasanton (down 21%), Milpitas (12%) and Hayward (8%). Atherton’s are up 19%.
That’s what a crash looks like in a market where most owners don’t have to sell. The headline price barely moves. The payment goes up, and the number of people who can make it goes down.
So who’s right: the rich, or the people waiting?
I don’t think the people at the top are timing the bottom. They’re buying because they can, and they’re not waiting for interest rates to give them permission.
The people in the middle are waiting for a crash. A lot of them can afford to buy. They’re waiting for 20% off.
Here’s my take: below the very top, the discount already showed up. It came as more choice, not lower prices. Milpitas had 42 houses for sale in September, up from 18 a year earlier. Cupertino had 50 in April, up from 32. Santa Clara had 69 in May. Each of those was the most that city has had in two years. Houses there still sell over asking on average, but in Cupertino and Santa Clara buyers are paying less over asking than they did last year. That’s the deal. It just doesn’t make a headline.
The gap is the real story
If you own in the middle and want to move up someday, this is the number that matters.
From January through September 2025, the median Palo Alto house sold for $2.15M more than the median Fremont house. Over the same months of 2026, the gap was $2.42M. It grew about $270,000 in a year.
That’s the K in one number. Waiting doesn’t just cost you the payment. It can cost you the gap.
What I’d do right now
- Buying in the middle: stop waiting for a crash that already happened. Look hard at houses that have been sitting for three weeks or more. That’s where the room is. Get your loan approval done first so you can move.
- Selling in the middle: the $10M Atherton headlines aren’t your comps. Price to the last three months of sales in your city.
- Moving up: run the sale and the purchase as one deal. The gap is your real price, not the list price.
- Buying at the top: you’re competing with AI money. Expect to pay over asking, and have your financing and the disclosures done before you write.
Every city I track has its own page with two years of monthly numbers, updated from the MLS every month. You’ll find them all on my market report page.
WHAT DOES THIS MEAN FOR YOUR HOUSE?
Text me your address. I’ll pull the sales that actually compete with your house and tell you which side of the K it’s on.
Questions people ask
Is the Bay Area housing market crashing?
Not in prices. From January through September 2026, median single family home prices in Fremont, Union City, Milpitas, Santa Clara, Pleasanton, Newark and Hayward were flat to 6% lower than in the same months of 2025, while Atherton, Menlo Park, Palo Alto and Los Altos were up 1% to 33%. What crashed is affordability: at a 7.4% rate, principal and interest on a typical $1.41M Union City house with 20% down is about $7,810 a month, about $830 more than a year earlier.
Why are high end Bay Area home prices still going up?
A lot of it is AI money. In September the Associated Press reported that affluent buyers, many of them working at AI companies, are buying multimillion dollar Bay Area homes despite higher rates. Redfin found luxury home sales in the San Francisco metro area up 39.3% in the first half of 2026, vs 15.1% for the middle of the market.
Should I wait for Bay Area home prices to drop?
Below the very top of the market, the discount already showed up as more choice rather than lower prices. Milpitas had 42 houses for sale in September, the most in two years, and in Cupertino and Santa Clara buyers are paying less over asking than they did last year. If the payment works at today’s rate, look hard at houses that have been sitting for three weeks or more.
How much has the gap between Palo Alto and Fremont grown?
From January through September 2025, the median Palo Alto house sold for $2.15M more than the median Fremont house. Over the same months of 2026, the gap was $2.42M, about $270,000 wider in a year.
SOURCES
Associated Press, September 2, 2026: AI money and Bay Area home buyers ↗
Redfin: OpenAI and Anthropic employees’ IPO money and San Francisco homes ↗
Freddie Mac, Primary Mortgage Market Survey ↗
National Association of REALTORS®, 2025 Profile of Home Buyers and Sellers ↗
Payments are principal and interest on a 30 year fixed loan, before taxes and insurance.
Based on information from the MLSListings MLS as of 10/13/2026 for single family homes in Atherton, Menlo Park, Palo Alto, Los Altos, Saratoga, Cupertino, Los Gatos, Santa Clara, Milpitas, Fremont, Union City, Newark, Hayward and Pleasanton: closed sales from January 1 to September 30 of 2025 and 2026; and for single family homes in Milpitas, Cupertino and Santa Clara: active listings by month from October 2024 through September 2026. All data, including all measurements and calculations of area, is obtained from various sources and has not been, and will not be, verified by broker or MLS. All information should be independently reviewed and verified for accuracy. Properties may or may not be listed by the office/agent presenting the information. Percent changes are calculated from the full figures before rounding.