By Amrit Singh, REALTOR® · The Oberoi Group at Intero Real Estate · Published October 7, 2026 · MLS data as of 10/06/2026
Every buyer I talk to says some version of the same thing: I’ll buy when the market comes down.
Here’s the thing. In a lot of Bay Area neighborhoods, it already came down. I pulled the comps in three East Bay neighborhoods I know well. Single family homes there are selling for 7% to 15% less per square foot than they did in spring 2025. And most of the people who were waiting for that are still waiting.
So, waiting for what?
One thing before the numbers: I’m only talking about the Bay Area. I don’t claim to know what the rest of the country is doing.
Why the headlines say nothing changed
Read the headlines and prices look flat. The California Association of REALTORS® put the Bay Area median at $1,272,000 in August, down 0.2% from a year earlier. Basically nothing.
That’s why I don’t use the median to decide whether prices went up or down. The median is just the price of the home in the middle of whatever happened to sell. If more big houses sell this year, the median goes up, even if every house is selling for less.
A real example. Within a mile of the center of Mission San Jose, the median sale price this summer was 13% higher than last summer. Sounds like prices went up. But price per square foot went down 3%. A different mix of homes sold. Nothing got more expensive.
So I look at it the way I’d price a house for a client: what sold nearby, adjusted for size. Price per square foot, neighborhood by neighborhood, then and now.
What sold within a mile, then and now
I picked a central point in three neighborhoods and pulled the single family homes that sold within a mile of it, in three stretches: spring 2025 (March to May), last summer (July to September 2025) and this summer (July to September 2026).
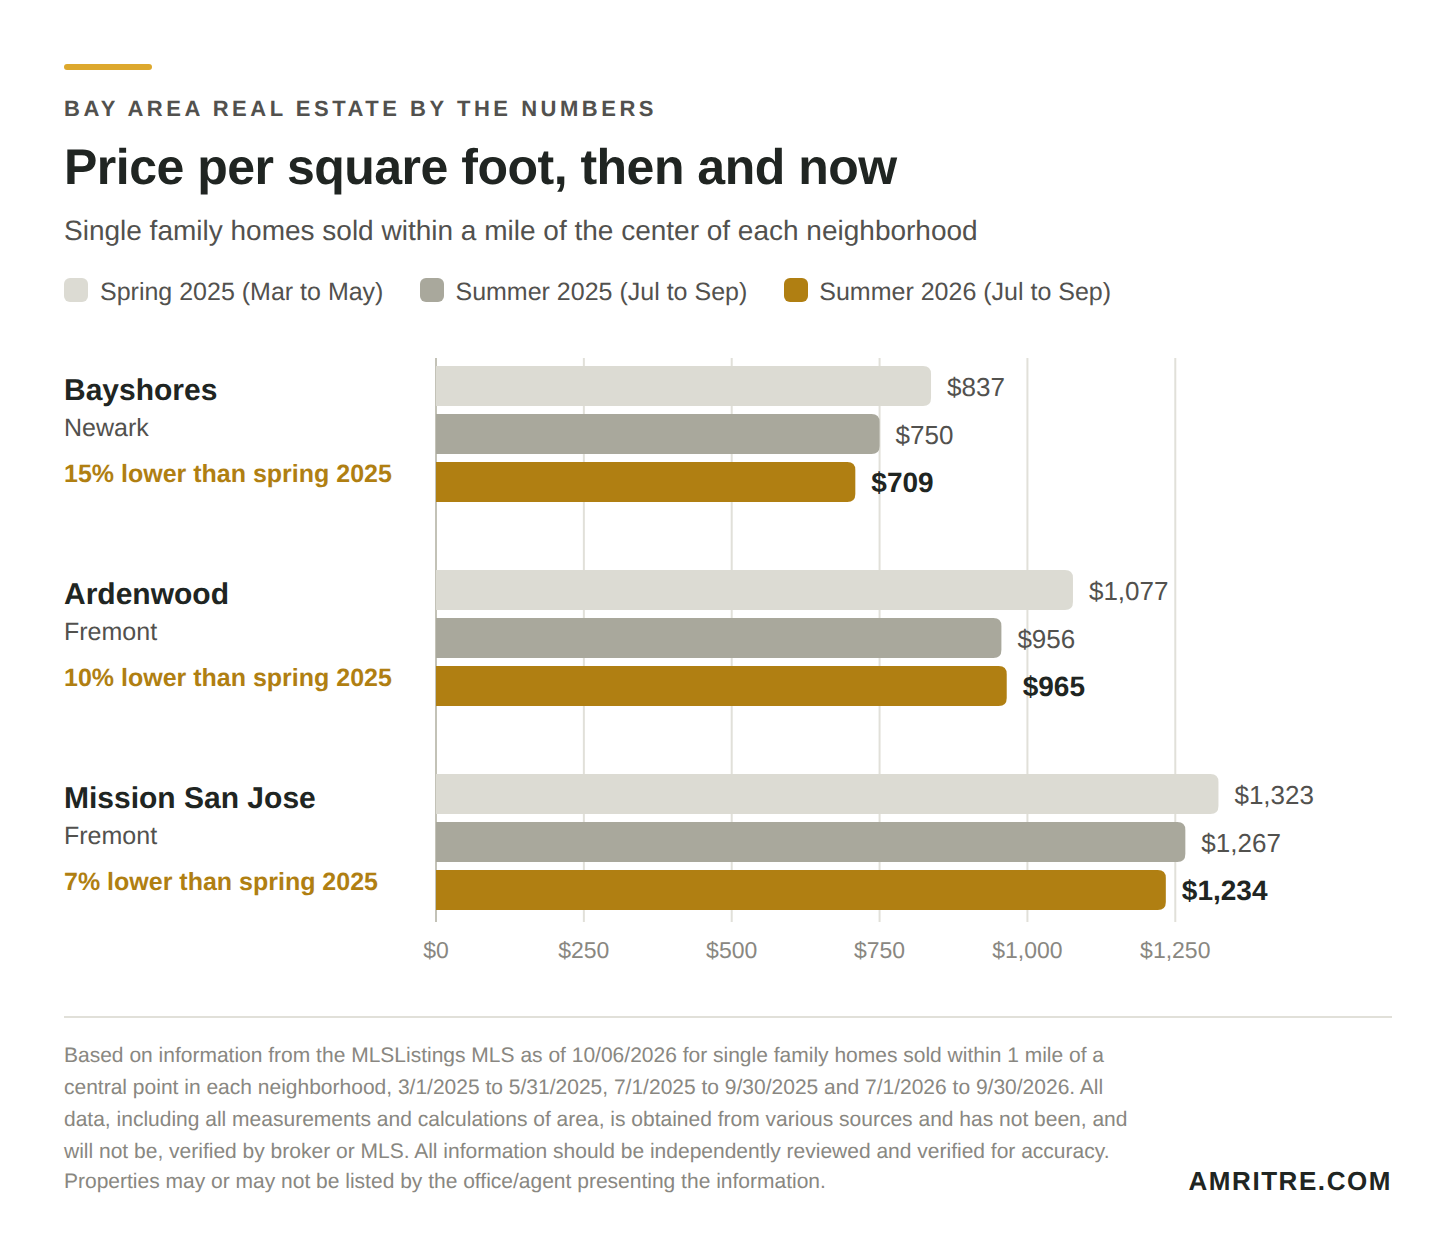
| Price per sq ft | Bayshores Newark | Ardenwood Fremont | Mission San Jose Fremont |
|---|---|---|---|
| Spring 2025 | $837 | $1,077 | $1,323 |
| Summer 2025 | $750 | $956 | $1,267 |
| Summer 2026 | $709 | $965 | $1,234 |
| Since spring 2025 | Down 15% | Down 10% | Down 7% |
| Since summer 2025 | Down 5% | Flat | Down 3% |
Bayshores, Newark
$837 a square foot in spring 2025. $709 this summer. That’s 15% less, or more than $250,000 on a 2,000 square foot house. And this spring was no better: $703 a square foot from March to May 2026, 16% below the same months a year earlier. Spring is usually when Bay Area prices are strongest. This year it didn’t bring them back.
Ardenwood, Fremont
$1,077 a square foot in spring 2025, $965 this summer. 10% lower. Compared with last summer it’s flat, which tells you something: the drop happened in 2025, and a year later prices are still at that lower level.
Mission San Jose, Fremont
$1,323 a square foot in spring 2025, $1,234 this summer. 7% lower. One of the most expensive neighborhoods in Fremont, and it’s still below its spring 2025 level.
Condos and townhomes fell further
Around Ardenwood, townhomes are 15% lower per square foot than in spring 2025 and condos are 13% lower. Around Bayshores, condos are 14% lower.
The drop already happened
Notice the pattern. Most of the drop happened last year. Compared with last summer, prices are flat to 5% lower. The discount isn’t new. It’s been sitting there for a year while people waited for a bigger one.
These are three examples, not a full market report, and a handful of sales can move a neighborhood’s numbers. That’s exactly why I look at price per square foot and the actual homes behind it, not one headline number. And it’s not every part of the Bay Area. At the very top, in places like Palo Alto and Los Altos, it’s a different story. I wrote about that in my high end report.
More homes to choose from, and more price cuts
Prices aren’t the only thing that changed. Buyers have more to choose from than they’ve had in years. In my September report, Fremont, Union City, Newark and Hayward had more houses for sale than in any September of the last four years.
Sellers are cutting, too. Redfin says 27.3% of Fremont homes for sale had a price drop in August, up 3.5 points from a year earlier.
What the headlines miss: the homes priced right still sell fast. Half the houses that sold in Fremont in September went in 12 days or less. The house priced at today’s number gets offers. The house priced at last spring’s number sits, cuts, and sits again.
There are two kinds of sellers
Every listing has a seller. Not every seller is really selling.
Sellers who want to sell. They’ll sell if they get their number, and their number is usually last spring’s. If they don’t get it, they take the house off the market and try again next year. You won’t get a deal from them, and you shouldn’t waste your time trying.
Sellers who have to sell. A job in another state. A new house already bought. An estate. A divorce. Two mortgage payments every month the house doesn’t sell. These sellers care about certainty and timing as much as price. That’s where the haircut happens.
How do you tell them apart? Days on market. Price history. A vacant house. A listing that came back after it didn’t sell. And the simplest one: your agent calls the listing agent and asks what the seller needs. Price, timing, a quick close, a rent back. The answer tells you a lot.
Could prices drop more?
Yes. I’m not going to tell you this is the bottom. Nobody knows where the bottom is, and anyone who says they do is guessing.
Rates are the big variable. The 30 year fixed averaged 7.28% on October 1, according to Freddie Mac, the highest since November 2023. A year ago it was 6.34%. In late February it dipped to 5.98%, the first time under 6% in three and a half years. If rates stay this high, prices could slide further.
But think about what you’re actually waiting for. Most buyers on the sidelines are waiting for the same thing: lower rates. When rates drop, they don’t come back one at a time. They come back the same weekend. Even with more homes on the market, Fremont, Union City, Newark and Hayward had about two months of supply in September. It doesn’t take many extra buyers to bring back multiple offers.
So you can wait for a lower price, or you can wait for a lower rate. You almost never get both at the same time.
The way I think about it: you can refinance a rate. You can’t refinance the price you paid. Refinancing isn’t free and rates may not cooperate, so that only works if the payment works today. Run the numbers at today’s rate, not the rate you’re hoping for. If it only works at 6%, it doesn’t work.
Who should keep waiting
I’m not telling everyone to buy. Keep waiting if:
- You might move again in the next few years. Buying and selling costs too much to do it fast.
- The payment only works at a rate you don’t have yet.
- Your job or income isn’t steady right now.
- Buying would leave you with no cushion after closing.
Waiting is a strategy when you have a reason. Without one, it’s just a habit.
If you’re ready
- Get fully approved, not just prequalified. A seller who has to sell wants certainty, and a full approval is how you show it.
- Look hard at the homes that have been sitting or have had a price cut. That’s where the sellers who have to sell are.
- Ask for more than price. A seller credit toward buying down your rate can sometimes do more for your monthly payment than the same amount off the price. Have your lender run both.
- Judge a price against what sold within a mile in the last few months, not against last year’s list prices.
WATCHING A HOUSE?
Send me the address. I’ll pull what sold within a mile, last year and this year, by price per square foot, and tell you straight whether it’s a deal or just a price.
Questions people ask
Are home prices going down in the Bay Area?
In a lot of neighborhoods, yes, even though the headline median looks flat. In three East Bay examples, single family homes sold within a mile of the center of Bayshores in Newark, and Ardenwood and Mission San Jose in Fremont, went for 7% to 15% less per square foot from July to September 2026 than from March to May 2025. Compared with July to September 2025, prices were flat to 5% lower. The top of the market, in places like Palo Alto and Los Altos, is a different story.
Why does the median home price look flat if prices are down?
Because the median is just the price of the home in the middle of whatever sold. If a different mix of homes sells, the median moves even when values don’t. Within a mile of the center of Mission San Jose, the median sale price from July to September 2026 was 13% higher than a year earlier, while price per square foot was 3% lower.
Should I wait for Bay Area home prices to drop more?
They could drop more, and nobody knows where the bottom is. But in many East Bay neighborhoods the drop already happened in 2025. Most buyers on the sidelines are waiting for lower rates, and when rates fall they tend to come back at the same time. If the payment works at today’s rate and you plan to stay, waiting for a bigger discount means betting against all of them.
How do you find sellers who have to sell?
Look at days on market, price history, vacant homes and listings that came back after they didn’t sell. Then have your agent ask the listing agent what the seller needs: price, timing, a quick close or a rent back.
SOURCES
California Association of REALTORS®, August 2026 home sales and price report ↗
Freddie Mac, Primary Mortgage Market Survey ↗
Freddie Mac, February 26, 2026: rates drop below 6% for the first time in 3.5 years ↗
Redfin, Fremont housing market ↗
My September 2026 report: Fremont, Union City, Newark and Hayward →
Based on information from the MLSListings MLS as of 10/06/2026 for single family homes, townhouses and condominiums sold within 1 mile of a central point in Bayshores (Newark), Ardenwood (Fremont) and Mission San Jose (Fremont), 3/1/2025 to 5/31/2025, 7/1/2025 to 9/30/2025, 3/1/2026 to 5/31/2026 and 7/1/2026 to 9/30/2026; and for single family homes in Fremont, Union City, Newark and Hayward: active listings in September 2023, 2024, 2025 and 2026 and closed sales 9/1/2026 to 9/30/2026. All data, including all measurements and calculations of area, is obtained from various sources and has not been, and will not be, verified by broker or MLS. All information should be independently reviewed and verified for accuracy. Properties may or may not be listed by the office/agent presenting the information. Percent changes are calculated from the figures shown.